As a QA engineer, I’ve always understood that software testing isn’t just about clicking buttons and verifying outputs—it’s about understanding the entire system. Early in my career, when tests failed, I often relied on screenshots, logs, and manual exploration to figure out the root cause. This worked most of the time, but intermittent failures, API issues, or network-related problems were notoriously difficult to debug.
It wasn’t until I started exploring network-level debugging that I realized how much insight was hiding beneath the UI. Capturing and analyzing network requests and responses transformed the way we understood failures and drastically improved our QA efficiency. Here’s why debugging at the network level became a game-changer for QA teams.
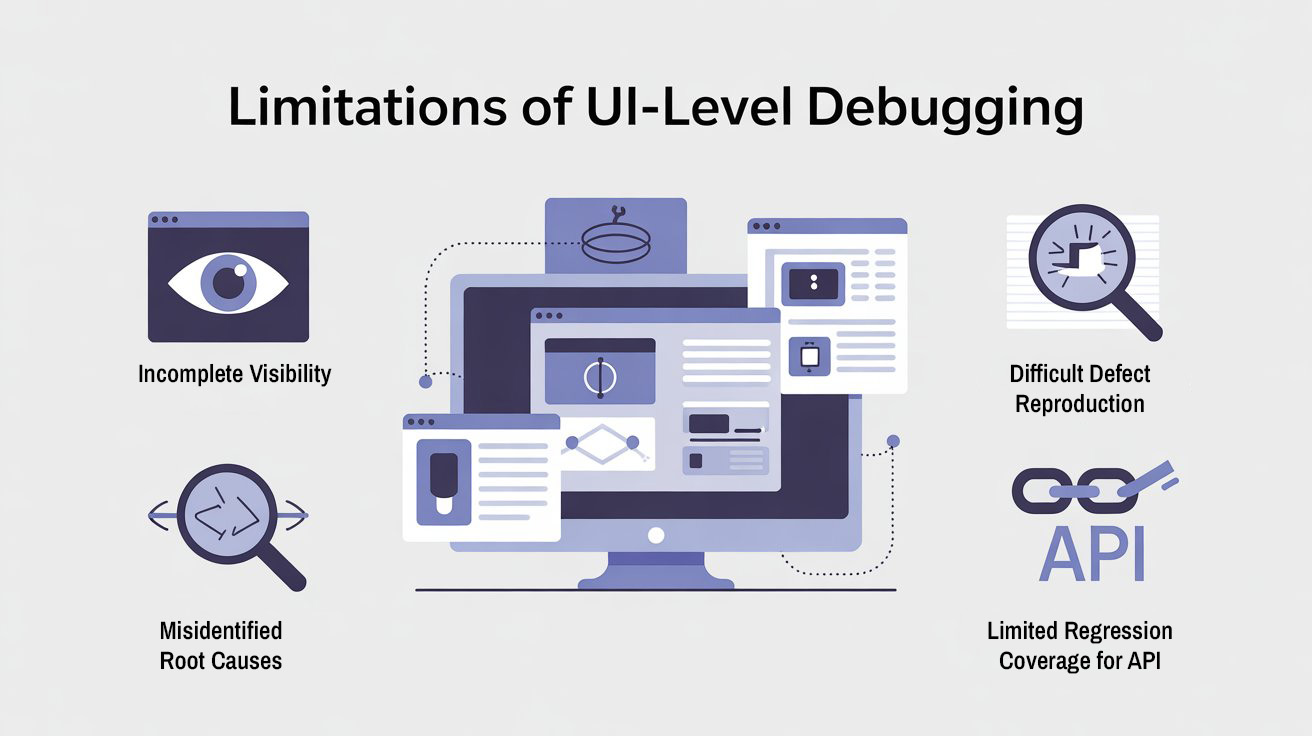
The Limitations of UI-Level Debugging
Before incorporating network-level analysis, our QA workflow faced several challenges:
1. Incomplete Visibility
UI tests show what the user sees, but not what happens behind the scenes. If a page fails to load data, the UI alone doesn’t reveal whether it’s a front-end rendering issue, a failed API call, or a network timeout.
2. Difficult Defect Reproduction
Developers often struggled to reproduce bugs based solely on UI evidence. Screenshots or error messages lacked the context of API requests, parameters, or server responses, slowing down defect resolution.
3. Misidentifying Root Causes
Without network-level insight, many failures were misclassified as front-end issues when the actual problem was in the backend or third-party services. This caused wasted effort and frustration.
4. Limited Regression Coverage for APIs
Automated UI tests often passed, but edge cases like API errors, timeouts, or malformed responses went undetected. We realized we were blind to critical failure paths.

Recommended for You: playwright interview questions
Why Network-Level Debugging Matters
Debugging at the network level involves capturing all HTTP/HTTPS requests and responses during test execution. This provides several benefits:
1. Full Visibility of Data Flow
By examining request headers, payloads, and responses, QA can see exactly what data is being sent and received. This enables identification of:
- API failures or error codes
- Unexpected response data
- Latency issues that impact UI rendering
2. Faster Root Cause Analysis
HAR files, network logs, and request traces allow developers and QA to reproduce failures accurately. Instead of guessing, we could pinpoint whether a bug was in the frontend, backend, or network layer.
3. Better Handling of Third-Party Integrations
Many applications rely on external APIs. Network-level debugging helps QA:
- Detect failures from third-party services
- Understand how the system behaves under network errors or slow responses
- Validate retry logic and error handling
4. Detecting Hidden Defects
Even when the UI displays correct information, network-level analysis can reveal hidden failures, such as:
- Incorrect data returned from APIs
- Missing fields or unexpected formats
- Failed authentication or authorization errors
This strengthens regression coverage and ensures that automation captures real issues rather than just visual symptoms.


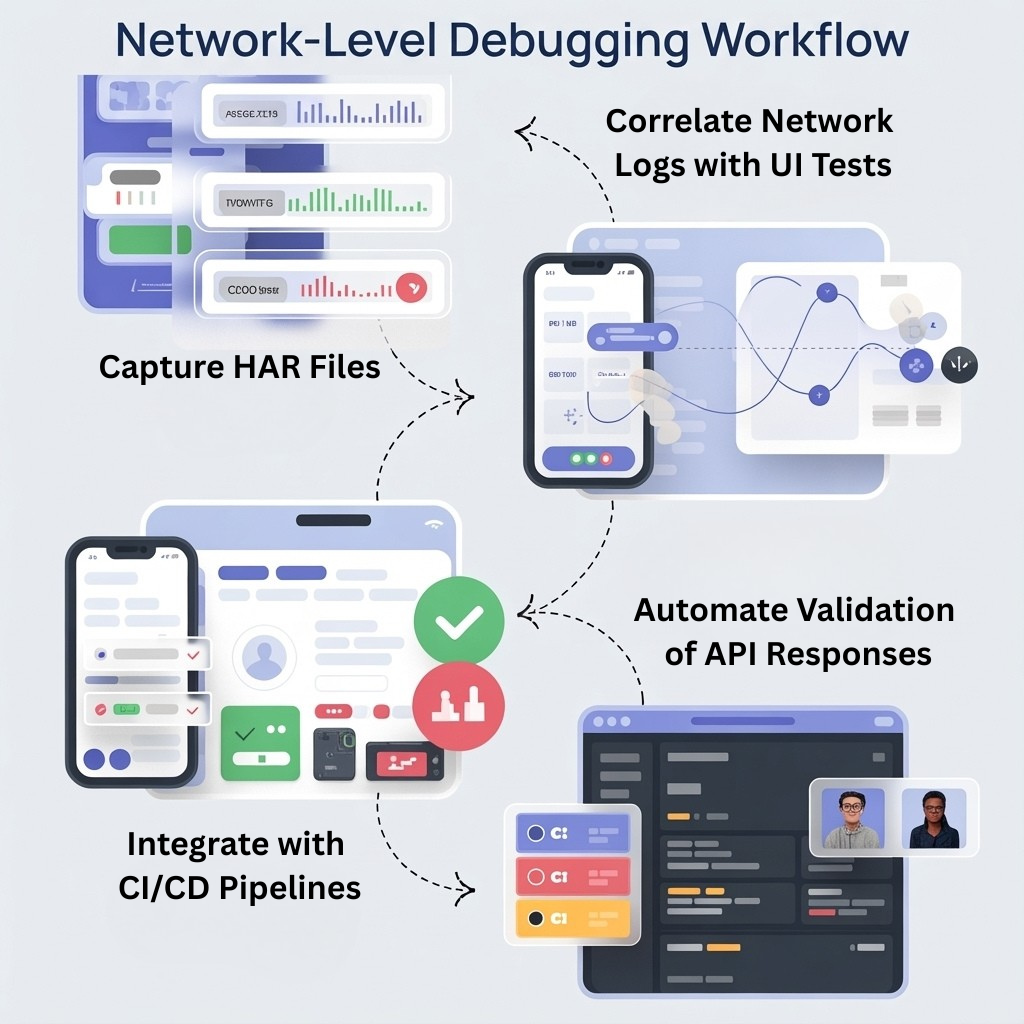
Implementing Network-Level Debugging in QA
In our automation framework, we integrated network-level analysis systematically:
Step 1: Capture HAR Files
We configured Selenium tests to capture HAR (HTTP Archive) files during execution. HAR files log:
- Requests and responses
- Status codes
- Headers and payloads
- Timing and latency information
These files became a central source of network evidence for each test run.
Step 2: Correlate Network Logs with UI Tests
For each test failure, we linked the HAR file to the specific test case. This allowed QA and developers to:
- Identify which API caused a failure
- Examine request/response payloads in detail
- Understand the sequence of events leading to the failure
This correlation provided actionable evidence instead of just a screenshot or error message.
Step 3: Automate Validation of API Responses
We extended our framework to analyze HAR files programmatically:
- Validate status codes and error messages
- Check response structure and data integrity
- Detect slow responses or timeouts
Automating network validation reduced manual analysis and allowed tests to flag network-level failures automatically.
Step 4: Integrate with CI/CD Pipeline
Network-level debugging was integrated into our CI/CD pipeline:
- Tests captured network logs for each build
- HAR files and network artifacts were uploaded to a centralized repository
- Stakeholders could review logs alongside test results for full transparency

This integration ensured consistent monitoring of network behavior across every release.
Also, Know More About: selenium interview questions
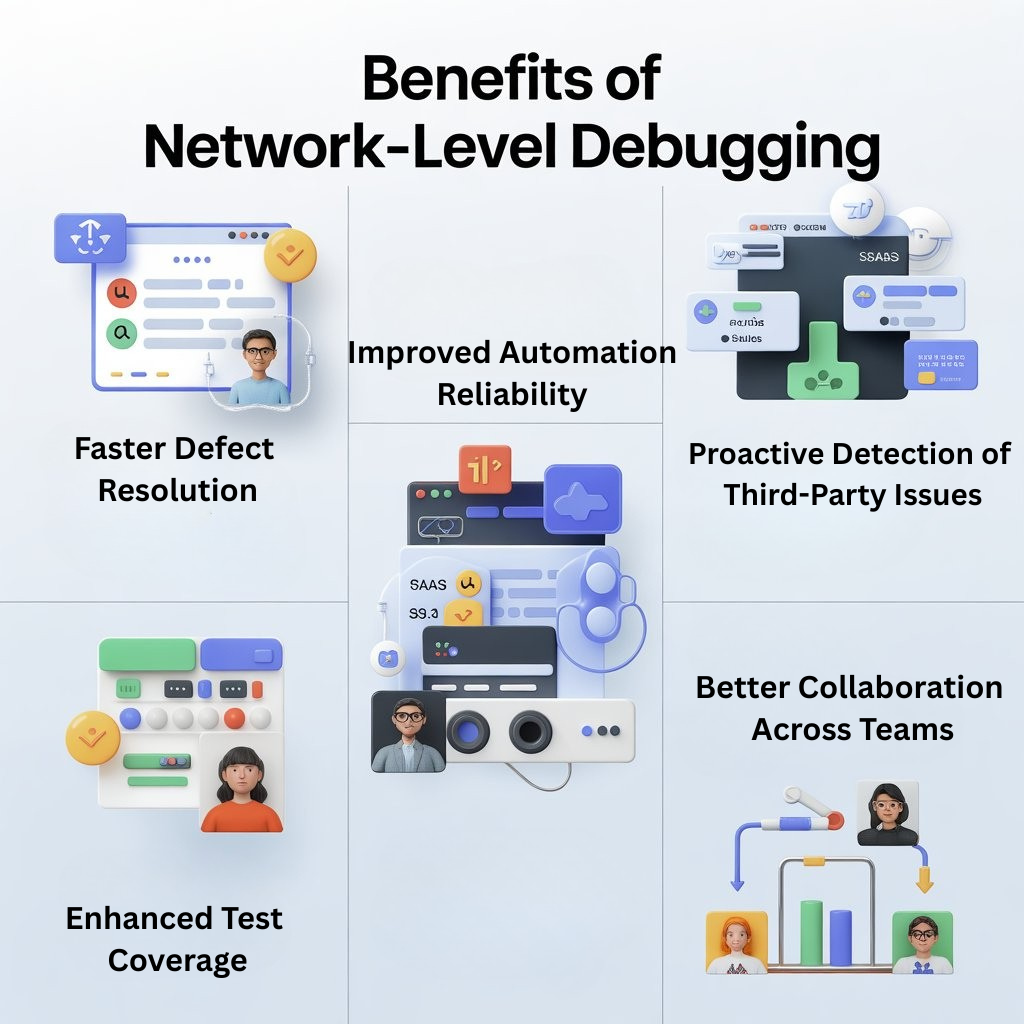
Benefits Observed
Implementing network-level debugging produced significant improvements:
1. Faster Defect Resolution
Developers could immediately see the exact request and response that caused a failure, eliminating guesswork and reducing resolution time.
2. Improved Automation Reliability
By validating API responses and network behavior automatically, we reduced false positives in UI tests and increased trust in the automation suite.
3. Proactive Detection of Third-Party Issues
We could detect failures caused by third-party services before they impacted production, allowing teams to respond proactively.
4. Enhanced Test Coverage
Network-level analysis uncovered hidden defects that UI-only tests would miss, strengthening regression and smoke test effectiveness.
5. Better Collaboration
Centralized network logs and HAR files improved communication between QA and development teams. Everyone had access to the same evidence, reducing friction and misunderstandings.
Lessons Learned
From my experience, several principles stand out:
- Network Insight Is Critical
UI tests alone cannot catch all defects. Network-level debugging provides end-to-end visibility and uncovers issues that would otherwise go unnoticed. - Evidence Matters
Capturing HAR files and network logs transforms test failures from abstract errors into actionable, reproducible insights. - Automation Should Include Network Validation
Integrating network checks into automation ensures that pipelines catch both UI and backend issues consistently. - Centralize and Correlate Artifacts
Centralized storage of HAR files, logs, and videos, linked to test cases, enables faster debugging and reporting. - Focus on High-Impact Scenarios
While capturing network data for all tests is ideal, prioritizing critical flows and integration points ensures maximum value without excessive overhead.
Conclusion
Debugging at the network level is a game-changer for QA teams. It provides full visibility into application behavior, accelerates defect resolution, and strengthens automation reliability.
From my perspective as a tester, network-level insights transform QA from a reactive process into a proactive, strategic function. By capturing HAR files, analyzing API responses, and integrating network checks into CI/CD pipelines, we gain actionable evidence that drives better decision-making, faster releases, and higher-quality software.
In today’s complex software landscape, understanding the network layer is no longer optional—it’s essential. For QA teams aiming to future-proof their testing and deliver confident releases, network-level debugging is an indispensable tool.
FAQs
Q1. What is network-level debugging in QA?
Network-level debugging means capturing and analysing all HTTP/HTTPS requests and responses during a test run. QA teams review headers, payloads, status codes and timings to see exactly what data is sent, received and where failures occur.
Q2. Why isn’t UI-only debugging enough?
UI tests show what the user sees, but they hide what’s happening behind the scenes. Without network insight, teams can misidentify root causes, struggle to reproduce defects and miss API or third-party issues that don’t visibly break the screen.
Q3. What artifacts are used for network-level debugging?
Common artifacts include HAR (HTTP Archive) files, network logs and traces. They capture requests, responses, status codes, headers, payloads and latency, giving QA and developers a detailed timeline of what happened during each test.
Q4. How can I integrate network-level debugging into automation and CI/CD?
You can configure your automation framework to capture HAR files during every run, link them to individual test cases and upload them into a central repository from the CI/CD pipeline. This keeps network evidence available alongside test results for every build.
Q5. What benefits do QA teams see from network-level debugging?
Teams typically see faster defect resolution, more reliable automation, proactive detection of third-party issues, stronger regression coverage and better collaboration between QA and developers because everyone shares the same network evidence.
Q6. Do I need to capture network data for every test?
Capturing network data for all tests is ideal, but you can start by prioritising high-impact user journeys and critical integration points. This gives maximum value without adding too much overhead while you refine your approach.
We Also Provide Training In:
- Advanced Selenium Training
- Playwright Training
- Gen AI Training
- AWS Training
- REST API Training
- Full Stack Training
- Appium Training
- DevOps Training
- JMeter Performance Training
Author’s Bio:


Content Writer at Testleaf, specializing in SEO-driven content for test automation, software development, and cybersecurity. I turn complex technical topics into clear, engaging stories that educate, inspire, and drive digital transformation.
Ezhirkadhir Raja
Content Writer – Testleaf
![]()