Introduction
Top ways to Troubleshoot Selenium Script Failures robotization with Selenium is a lifesaver for testers, but there’s catch test scripts don’t always bear as anticipated. One failed run and you’re left gaping at endless error logs. The real difference between a frustrated tester and a confident QA professional is the capability to remedy failures snappily and effectively. This companion will walk you through the most common reasons Selenium scripts fail and the top ways to troubleshoot them like a pro.
Why Selenium Tests Fail (Common Causes)
Selenium scripts often fail for reasons beyond simple coding errors. Some common causes are:
- Fragile or incorrect locators (XPaths, CSS selectors).
- Pages not fully loaded before the script interacts with elements.
- Synchronization issues between the browser and the script.
- Version mismatches in browsers, drivers, or environments.
- Dynamic UI or DOM changes after application updates.
- Problems with iFrames, Shadow DOMs, or nested structures.
- Exceptions not being handled properly.


Other Useful Guides: api testing interview questions
How to Debug Selenium Scripts: 10 Techniques
1. Read the Stack Trace
The mound trace is your stylish indication when effects go wrong. It tells you
- The type of exception (e.g., NoSuchElementException, TimeoutException).
- The line number where the error passed.
- The sequence of method calls leading up to the failure.
Exception in thread “main” org.openqa.selenium.NoSuchElementException: no such element
(Session info: chrome=114.0)
Element info: {Using=xpath, value=//button[@id=’login’]}
at org.openqa.selenium.remote.RemoteWebDriver.findElement(RemoteWebDriver.java:337)
at com.test.LoginPage.clickLogin(LoginPage.java:25)
at com.test.LoginTest.testLogin(LoginTest.java:15)
Crucial points to check in a mound trace:
- The exception type (NoSuchElementException, TimeoutException, etc.).
- The line number in your test where the error occurred.
- he call hierarchy, which tells you what sequence of methods executed before failure.Pro Tip: In Java, use Throwable.printStackTrace() to print detailed traces in a readable format.
2. Use Proper Logging Instead of Print Statements
System.out.println() works for small experiments, but in real test frameworks, it creates clutter. Instead, use logging frameworks like Log4j or SLF4J, which let you categorize messages as INFO, DEBUG, WARN, ERROR.
This makes it easier to:
- Track each step in execution.
- See what data was passed to the application.
- Understand whether the failure was expected or sudden.
private static final Logger logger = LogManager.getLogger(LoginTest.class);
@Test
public void testLogin() {
logger.info(“Launching cybersurfer”);
driver.get(“https://example.com”);
logger.debug(“Entering username and password”);
driver.findElement(By.id(“username”)).sendKeys(“testuser”);
driver.findElement(By.id(“password”)).sendKeys(“pass123”);
logger.info(“Clicking login button”);
driver.findElement(By.id(“login”)).click();
}
With logging, you can:
• Monitor test flow step by step.
• Capture test data passed between methods.
• Classify logs with INFO, DEBUG, WARN, and ERROR levels.
• Integrate logs with reporting tools for better insights.
Recommended for You: automation testing interview questions


3. Take Screenshots on Failures
A screenshot at the exact moment of failure is often worth more than a hundred logs. It shows what the application looked like when things broke — missing elements, overlays, or alert pop-ups become immediately visible.
public void takeScreenshot(String testName) {
File srcFile = ((TakesScreenshot) driver).getScreenshotAs(OutputType.FILE);
File destFile = new File(“screenshots/” + testName + “.png”);
FileUtils.copyFile(srcFile, destFile);
}
Integrate screenshot capture in your framework so that whenever a failure occurs, the screenshot is automatically attached to your test reports (e.g., ExtentReports, Allure).
4. Fix Synchronization Issues with Smart Waits
One of the biggest reasons Selenium tests fail is timing. The script is faster than the page. Many beginners rely on Thread.sleep(), but this leads to slow and short scripts.
The result? Use Explicit Waits (WebDriverWait). They only break until a specific condition is met (like visibility of an element), making scripts briskly and more dependable.
WebDriverWait wait = new WebDriverWait(driver, Duration.ofSeconds(10));
WebElement element = wait.until(ExpectedConditions.visibilityOfElementLocated(By.id(“login”)));
Smart delays insure that your script waits only as long as necessary. synopsize them in mileage classes with logs for reusability.
5. Debug with Browser Developer Tools
Your browser’s DevTools (F12) is one of the most powerful allies for debugging. You can:
- Inspect and test locators directly (XPaths, CSS).
- Spot JavaScript errors in the console.
- Use the Network tab to verify if APIs are delayed or failing.
- Investigate if elements are inside iFrames or Shadow DOMs.
Many failures come from small UI quirks that DevTools reveals instantly.
6. Add a Retry Medium for short Tests
Occasionally, tests fail due to temporary network glitches or garçon detainments. Rather of marking them as failed immediately, configure your framework to retry failed tests automatically.
For illustration, in TestNG you can use a RetryAnalyzer that re-runs failed tests a limited number of times before marking them as failed.
public class RetryAnalyzer implements IRetryAnalyzer {
private int retryCount = 0;
private static final int maxRetryCount = 2;public boolean retry(ITestResult result) {
if (retryCount < maxRetryCount) {
retryCount++;
return true;
}
return false;
}
}
This helps differentiate flaky failures from real bugs.
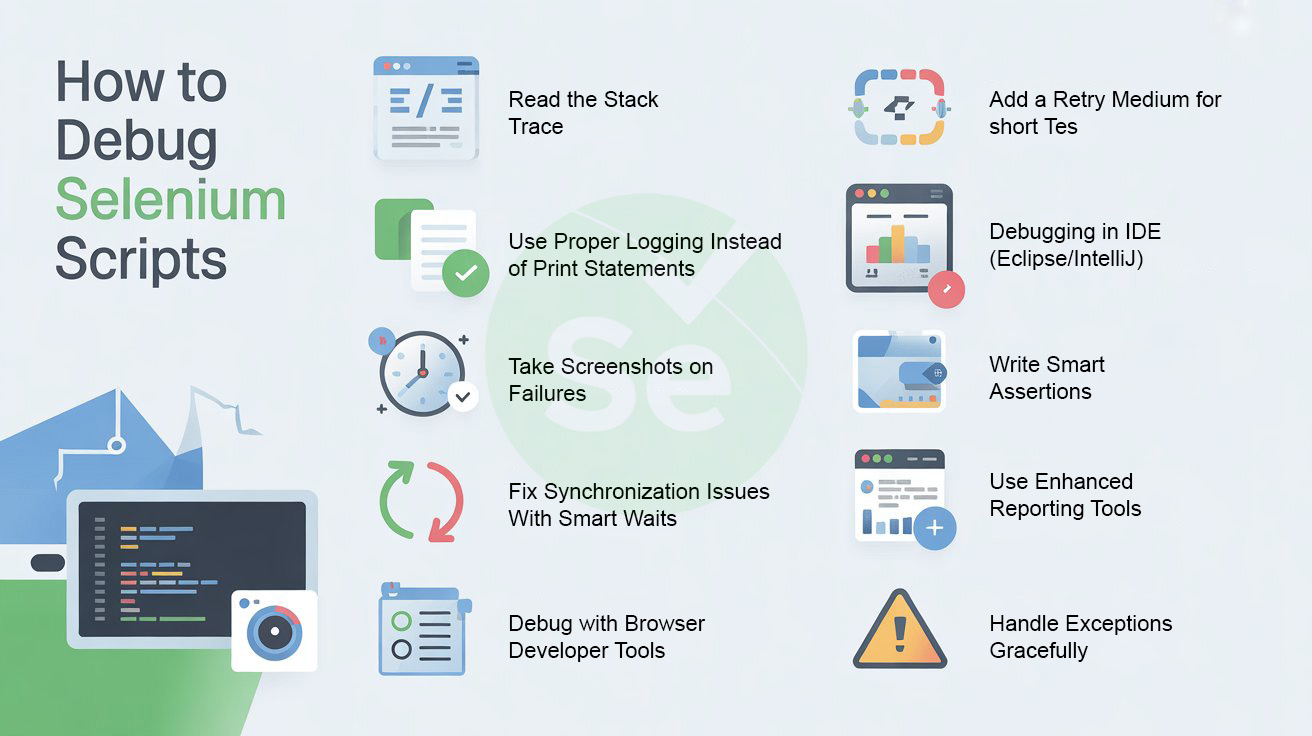

7. Debugging in IDE (Eclipse/IntelliJ)
If logs and screenshots don’t break the mystification. Run your test in Debug Mode in Eclipse or IntelliJ
With breakpoints, you can:
- Check variable values in real-time.
- Check if locators are being passed correctly.
- See how WebDriver behaves step-by-step.
It’s slower than normal execution but invaluable for finding hidden logic errors.
8. Write Smart Assertions
Assertions should not just check conditions; they should explain failures.
Assert.assertEquals(driver.getTitle(), “Dashboard”, “Page title did not match!”);
With dispatches, you’ll incontinently know what failed instead of guessing.
9. Use Enhanced Reporting Tools
Debugging becomes much easier with rich test reports. Tools like ExtentReports or Allure not only show which test failed but also:
- Step-by-step execution logs.
- Embedded screenshots.
- Failure details with exception traces.
Think of them as a “visual debugger” for your test suite.

10. Handle Exceptions Gracefully
Crashing the whole suite because of one unhandled exception is extravagant. rather, wrap actions in custom methods that log failures, take screenshots, and fail gracefully.
public void clickElement(By locator) {
try {
driver.findElement(locator).click();
reportStep(“Clicked element successfully”, “pass”);
} catch (Exception e) {
reportStep(“Failed to click element: ” + locator, “fail”);
throw e;
}
}
This way, you know exactly which step failed without halting the rest of the execution.
Bonus: Shadow DOM and iFrame Debugging
These are common troublemakers.
- For iFrames, always switch to the correct frame before interacting, then switch back to the default content.
- For Shadow DOM, use JavascriptExecutor to pierce the shadow boundary and access elements.
// Access Shadow DOM element
JavascriptExecutor js = (JavascriptExecutor) driver;
WebElement shadowHost = driver.findElement(By.cssSelector(“#shadow-host”));
WebElement shadowRoot = (WebElement) js.executeScript(“return arguments[0].shadowRoot”, shadowHost);
WebElement innerElement = shadowRoot.findElement(By.cssSelector(“.shadow-btn”));// Switch to iFrame
driver.switchTo().frame(“iframeId”);
driver.findElement(By.id(“insideFrame”)).click();
driver.switchTo().defaultContent();
These techniques eliminate one of the most frustrating classes of failures in Selenium.
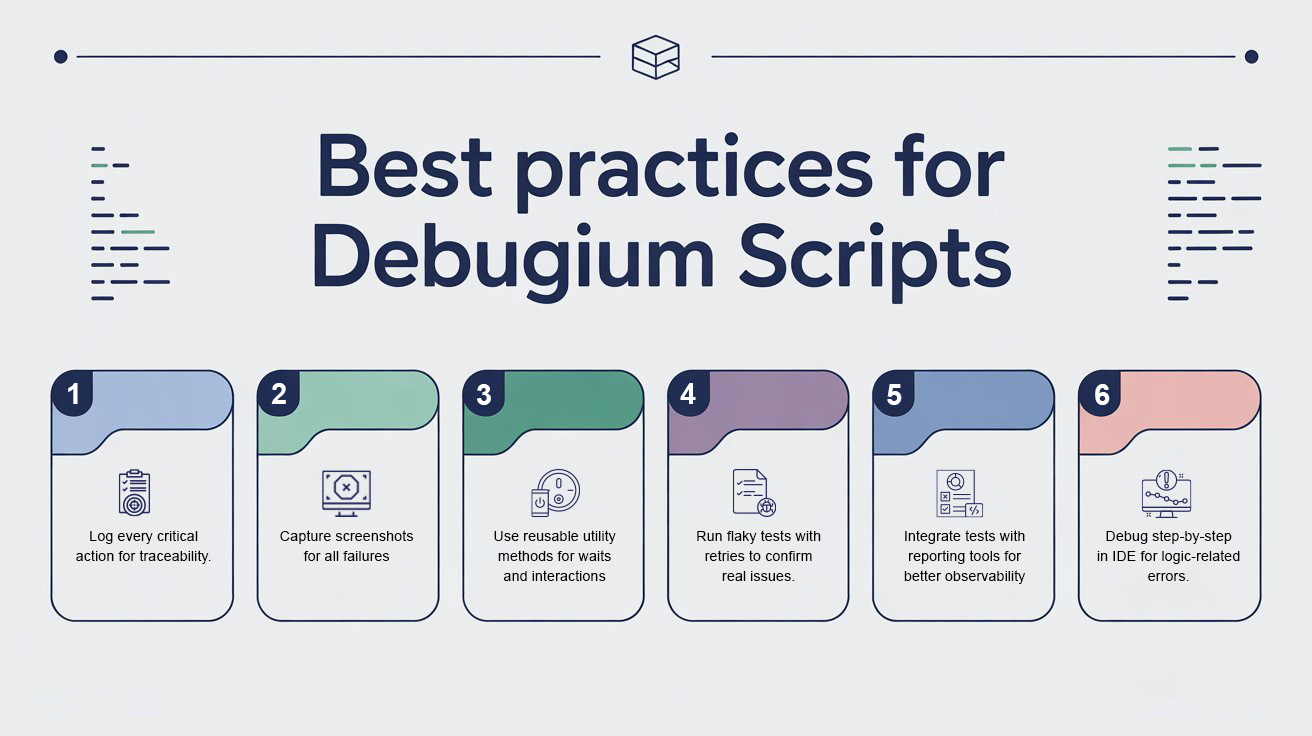
Best Practices for Debugging Selenium Scripts
- Always keep browser drivers in sync with browsers.
- Log every critical action for traceability.
- Capture screenshots for all failures.
- Use reusable utility methods for waits and interactions.
- Run flaky tests with retries to confirm real issues.
- Integrate tests with reporting tools for better observability.
- Debug step-by-step in IDE for logic-related errors.
Final Thoughts
Debugging is not just about fixing errors — it’s about understanding why they happen so you can prevent them in the future. With techniques like stack trace analysis, smart logging, screenshots, retries, enhanced reports, and IDE debugging, you’ll be well-equipped to troubleshoot Selenium failures like a pro.
👉 If you’re looking to upskill, explore our Selenium Training in Chennai to gain hands-on expertise and become job-ready.
Remember: consistent debugging practices lead to more reliable, maintainable, and professional test automation suites.
Frequently Asked Questions (FAQs)
What are the most common reasons Selenium tests fail?
Common reasons include fragile locators, sync issues, browser/driver mismatches, and DOM changes.
How do I debug Selenium scripts in Eclipse or IntelliJ?
Run your test in Debug Mode with breakpoints to inspect variables and step through execution.
How can I fix flaky Selenium tests?
Use smart waits, retries, and ensure environment stability to minimize flakiness.
What is the best way to handle iFrames and Shadow DOM in Selenium?
Switch frames properly and use JavascriptExecutor for Shadow DOM elements.
How do I capture screenshots on Selenium test failures?
Use TakesScreenshot interface in Selenium and attach images to reports for better debugging.
We Also Provide Training In:
- Advanced Selenium Training
- Playwright Training
- Gen AI Training
- AWS Training
- REST API Training
- Full Stack Training
- Appium Training
- DevOps Training
- JMeter Performance Training
Author’s Bio:


As CEO of TestLeaf, I’m dedicated to transforming software testing by empowering individuals with real-world skills and advanced technology. With 24+ years in software engineering, I lead our mission to shape local talent into global software professionals. Join us in redefining the future of test engineering and making a lasting impact in the tech world.
Babu Manickam
CEO – Testleaf
![]()