In the world of QA, debugging can often feel like trying to find a needle in a haystack. Test failures happen for a myriad of reasons, and when those failures happen in complex environments, finding the root cause can feel like an endless chase.
As a tester, I’ve dealt with my fair share of frustrating, seemingly random test failures. Sometimes it’s clear—an element isn’t found, or a button doesn’t respond. But other times, the issue isn’t with the UI or functionality; it’s buried deeper, in the communication between the browser and the server.
That’s when I discovered HAR files—a powerful, yet often underrated tool that has made a world of difference in debugging complex issues. In this blog, I’ll explain why HAR files are such a game-changer for QA, how they can simplify the debugging process, and why every QA professional should make them a regular part of their testing toolkit.
Check Out These Articles: automation testing interview questions
What Are HAR Files?
HAR stands for HTTP Archive, a file format that captures a detailed log of the interactions between your browser and the web server. HAR files contain the HTTP request and response information for each asset (HTML, images, scripts, etc.) loaded during a web session.
When you inspect a page using your browser’s developer tools, you can view a Network tab, which shows all the requests and responses between the client and the server. The HAR file essentially exports this data, providing a structured record of everything that happened during a browser session.
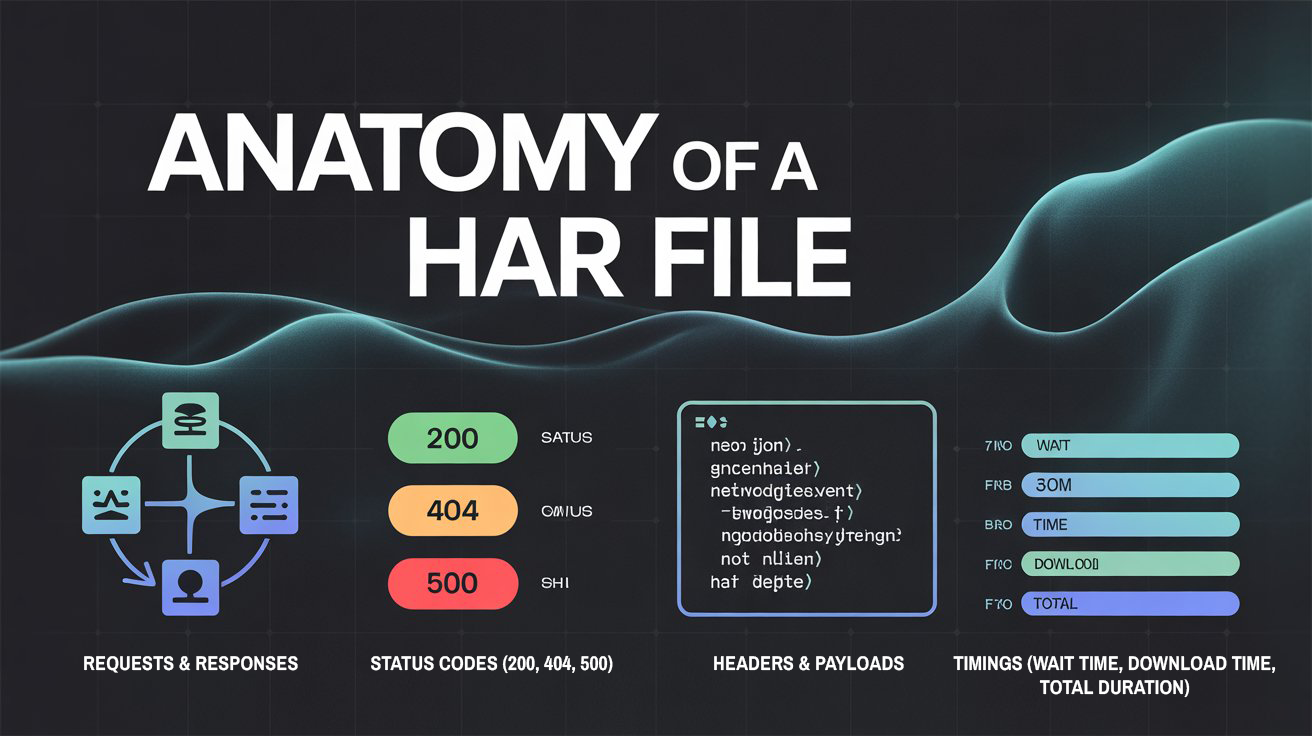
These files capture a wealth of information, including:
- Request and response headers
- Status codes (like 200 OK, 404 Not Found, 500 Internal Server Error)
- Request timings (including wait time, download time, etc.)
- Request/response bodies (if available)

Other Recommended Reads: api automation interview questions
Why HAR Files Matter for QA
When a test fails, identifying the root cause can be challenging, especially if the failure isn’t related to UI elements or visible errors. This is where HAR files come in. Here’s why they are invaluable:
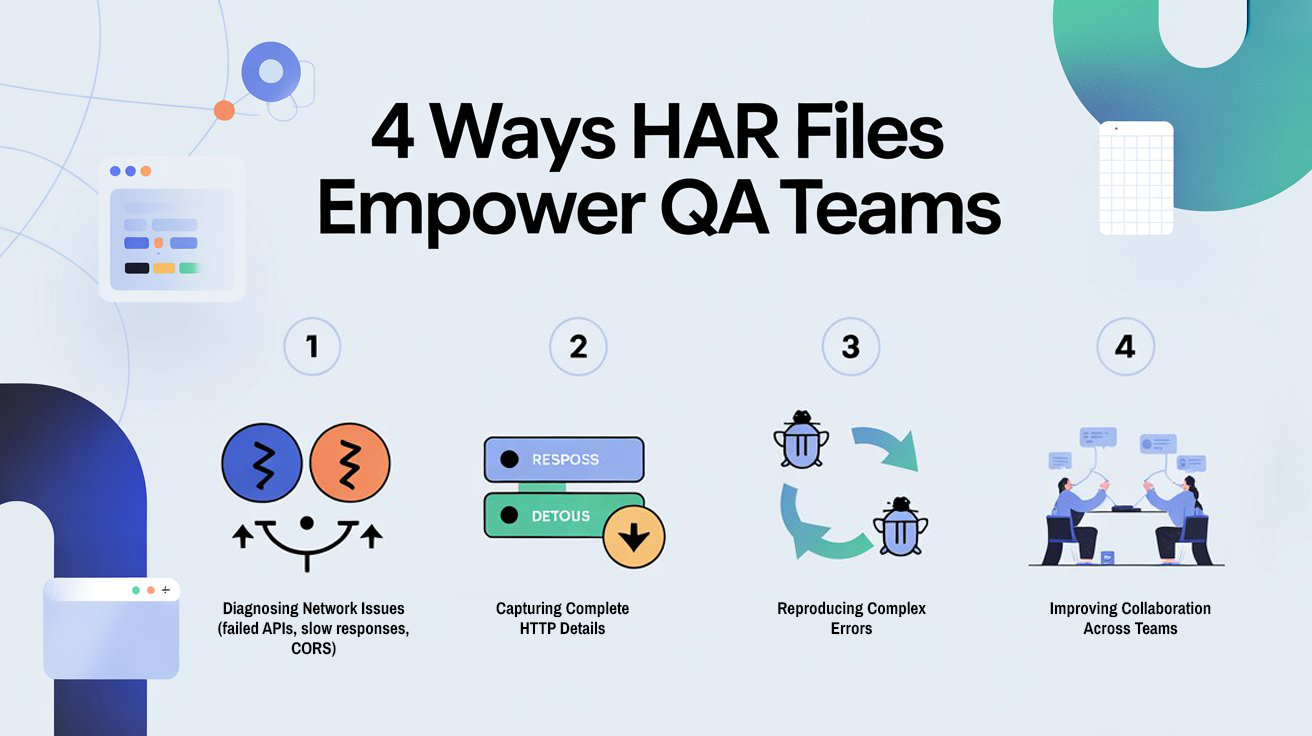
1. Diagnosing Network Issues
Sometimes the issue with a test isn’t with the UI or the application itself, but with how it communicates with the server. For example:
- A page might load, but some elements don’t show up because an API request fails in the background.
- A button might not trigger the desired action because the backend service is not responding or is returning an error.
HAR files allow you to dig deep into the requests and responses, identifying issues like:
- Slow API responses
- Failed requests
- Incorrect status codes (e.g., 500 Internal Server Error)
- CORS issues (Cross-Origin Resource Sharing)
This data is critical for debugging and helps pinpoint the underlying issues, especially when the error isn’t visible on the UI.


2. Capturing All the Details
Another key benefit of HAR files is their ability to capture every detail about an HTTP request. This includes:
- The exact payload sent to the server
- The response time for each request
- Cookies and cache data related to the session
If you’ve ever spent hours trying to track down why a request didn’t go through or failed, HAR files can save you a lot of time by showing you exactly what happened. Instead of guessing, you get a structured, easy-to-analyze record.
3. Reproducing Complex Errors
One of the biggest challenges in QA is reproducing issues, especially when they are intermittent or environment-specific. HAR files can help by giving you a snapshot of the network activity at the time of the error, allowing you to:
- Reproduce the exact sequence of requests and responses that led to the failure
- Identify whether specific server configurations or request parameters are triggering the issue
This makes HAR files particularly useful for identifying issues that occur due to specific data sets, user sessions, or server-side configurations.
4. Improving Collaboration
HAR files can also facilitate better collaboration between QA, development, and operations teams. When something goes wrong, sharing a HAR file provides a clear, standardized way to communicate the problem. Instead of trying to explain a network issue verbally, you can simply hand over a HAR file for analysis.
This allows developers to pinpoint server-side issues more quickly, and it can often reveal problems that would be difficult to communicate with just screenshots or error messages.
Don’t Miss Out: Epam interview questions
How to Generate and Use HAR Files
The good news is that generating HAR files is easy. Here’s how you can create one using Google Chrome (the process is similar for other browsers like Firefox and Edge):
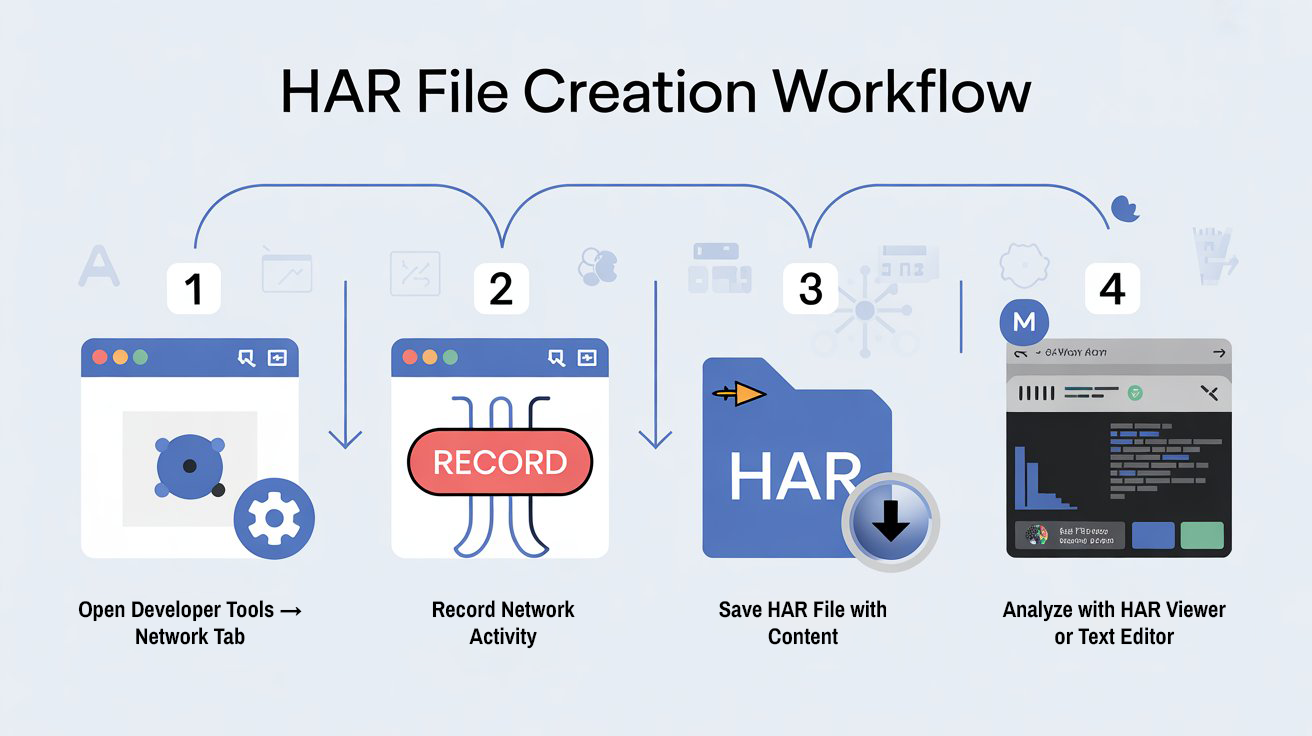
1. Open Developer Tools
Right-click on the page you want to debug and select Inspect. Then, go to the Network tab.
2. Record Network Activity
Refresh the page with the developer tools open so that all network activity is captured. The Network tab will start logging requests.
3. Save the HAR File
Once the page has loaded and all network requests have been captured, right-click anywhere in the Network tab and choose Save all as HAR with content. This will save the file to your computer.
4. Analyze the HAR File
You can now open the HAR file in a text editor or use online tools like HAR Viewer to analyze the data in a more readable format.
Common Issues You Can Diagnose with HAR Files
Here are a few examples of issues that HAR files can help you identify:
- API Failures: If a critical API request fails with a 500 error, you can see the exact request and response, including the error message.
- Slow Page Loads: If a page is taking too long to load, HAR files will show you which resources are taking the most time to load.
- Missing Assets: Sometimes images, scripts, or other assets don’t load properly. A HAR file can help you track down failed resource requests, such as missing files or 404 errors.
- CORS Issues: Cross-Origin Resource Sharing (CORS) issues can block requests between different domains. HAR files make it easy to see if CORS headers are configured correctly.

Best Practices for Using HAR Files in QA
- Automate HAR File Generation: If possible, automate the generation and capture of HAR files during your testing process. This can be done in integration with your test scripts, allowing you to capture network activity alongside test execution.
- Use HAR Files with API Testing: If your application is heavily reliant on APIs, use HAR files alongside tools like Postman or SoapUI to verify that API responses match expectations.
- Combine HAR Files with Screenshots: While HAR files capture network activity, they don’t give you visual information. Pair HAR files with screenshots or videos from your tests to get a complete picture of the issue.
- Share with Developers Early: If a bug is tied to a network issue, share the HAR file as soon as possible with the development team. It speeds up the debugging process and ensures they have the right context.
The Takeaway: HAR Files are an Essential Tool for QA
HAR files might not get the spotlight in the world of QA, but they are an essential tool for debugging complex, network-related issues. Whether you’re dealing with API failures, slow page loads, or missing resources, HAR files provide you with a comprehensive, structured log that allows you to pinpoint the root cause quickly.
Incorporating HAR files into your debugging process will not only save time but also improve the quality and reliability of your testing. It’s a tool that every QA professional should have in their arsenal, especially when dealing with complex, dynamic web applications.
FAQs
1. What is a HAR file in QA?
A HAR (HTTP Archive) file records all network requests and responses between the browser and server, helping QA identify backend and performance issues.
2. Why are HAR files useful for debugging?
They reveal failed API calls, slow resources, incorrect status codes, CORS issues, and payload details — making it easier to locate root causes.
3. How do I generate a HAR file in Chrome?
Open DevTools → Network tab → Refresh page → Right-click → “Save all as HAR with content.
4. Can HAR files help reproduce bugs?
Yes. HAR files provide a snapshot of network behavior, allowing testers and developers to replicate environment-specific issues.
5. Should QA share HAR files with developers?
Absolutely. HAR files improve collaboration by giving developers clear insight into network failures and backend response patterns.
We Also Provide Training In:
- Advanced Selenium Training
- Playwright Training
- Gen AI Training
- AWS Training
- REST API Training
- Full Stack Training
- Appium Training
- DevOps Training
- JMeter Performance Training
Author’s Bio:


Content Writer at Testleaf, specializing in SEO-driven content for test automation, software development, and cybersecurity. I turn complex technical topics into clear, engaging stories that educate, inspire, and drive digital transformation.
Ezhirkadhir Raja
Content Writer – Testleaf
![]()