Introduction
Preparing for a DevOps interview in 2026? The demand for DevOps engineers continues to skyrocket as companies adopt automation-first strategies, hybrid cloud infrastructure, and AI-assisted pipelines. Leading organizations like Infosys, TCS, Accenture, and AWS are seeking engineers who can manage CI/CD, Kubernetes, and cloud monitoring with hands-on expertise.
This guide covers the top DevOps interview questions and expert answers with real-world scenarios. Whether you’re a QA transitioning to DevOps or an experienced engineer preparing for a career leap, this article will help you stand out and secure your dream DevOps job in 2026.
1. Linux Fundamentals
Q1: What are the main differences between Linux file permissions and how do you change them?
Ans: Linux file permissions consist of three categories: owner (user), group, and others. Each has read (r=4), write (w=2), and execute (x=1) permissions. Use chmod to change permissions (e.g., chmod 755 file.txt gives owner full permissions, others read+execute). Use chown to change ownership and chgrp to change group. Example: chmod u+x script.sh adds execute permission for the user.
Q2: How do you monitor system performance and identify resource bottlenecks in Linux?
Ans: Use commands like top or htop for real-time CPU and memory usage, df -h for disk space, iostat for I/O statistics, and vmstat for virtual memory stats. For real-time scenario: if a production server is slow, check top to see which process is consuming CPU, use lsof to check open files, and ss -tuln to check network connections. Load average in uptime shows system load.
Q3: What is a systemd service and how do you create one?
Ans: Systemd is the init system that manages services. Create a service file at /etc/systemd/system/myservice.service with sections for [Unit], [Service], and [Install]. Example:
[Service]
ExecStart=/path/to/application
Restart=always
Then run systemctl daemon-reload, systemctl enable myservice, and systemctl start myservice. This is used in real-time for managing microservices or applications on servers.
Q4: How do you manage user accounts and sudo privileges in Linux?
Ans: Create users with useradd -m -s /bin/bash username, set passwords with passwd. For sudo privileges, add users to the sudo group with usermod -aG sudo username or edit /etc/sudoers with visudo. In production, you’d create service accounts with restricted privileges for running applications, and manage access control for security compliance.
Q5: Explain the Linux boot process and how systemd differs from older init systems.
Ans: The boot process: BIOS → bootloader (GRUB) → kernel → initramfs → systemd (PID 1). Systemd is faster than traditional init systems, uses parallel startup of services, provides dependency management, and includes journal logging. In real scenarios, systemd helps reduce server boot time and provides better service management for production deployments.
Continue Reading: selenium interview questions
2. Shell Scripting
Q1: Write a simple shell script to check if a directory exists and create it if it doesn’t.
Ans:
#!/bin/bash
DIR="/path/to/directory"
if [ ! -d "$DIR" ]; then
  mkdir -p "$DIR"
  echo "Directory created: $DIR"
else
  echo "Directory already exists"
fi
This is commonly used in deployment scripts to ensure necessary directories exist before applications run.
Q2: How do you handle errors and exit codes in shell scripts?
Ans: Use set -e to exit on any error, set -o pipefail to catch errors in pipes. Check exit codes with $?. Example:
#!/bin/bash
set -e
command1
if [ $? -ne 0 ]; then
  echo "Command failed"
  exit 1
fi
Real scenario: In a CI/CD pipeline, properly handling exit codes ensures that failed steps stop the pipeline immediately rather than continuing.
Q3: Write a script that processes multiple files in a directory with a loop.
Ans:
#!/bin/bash
for file in /path/to/files/*; do
  if [ -f "$file" ]; then
    echo "Processing: $file"
    grep "pattern" "$file" > "$file.backup"
  fi
done
Real use case: Log file rotation, processing backup files, or batch configuration updates.
Q4: How do you use variables, arrays, and string manipulation in shell scripts?
Ans: Variables are defined with VAR="value". Arrays use ARR=("one" "two" "three") and accessed with ${ARR[0]}. String manipulation: ${VAR:0:5} gets first 5 characters, ${VAR/old/new} replaces text. Example:
CONFIG_FILES=("app.conf" "db.conf")
for config in "${CONFIG_FILES[@]}"; do
  echo "Loading: $config"
done
Real scenario: Managing multiple configuration files in deployment scripts.

Q5: Write a script that monitors a process and restarts it if it’s down.
Ans:
#!/bin/bash
PROCESS="nginx"
while true; do
  if ! pgrep -x "$PROCESS" > /dev/null; then
    echo "$PROCESS is down, restarting..."
    systemctl start $PROCESS
    logger -t process_monitor "$PROCESS was restarted"
  fi
  sleep 60
done
Real scenario: Health check scripts in production to ensure critical services stay running, commonly used before modern orchestration like Kubernetes.
Further Reading: automation testing interview questions
3. Git
Q1: Explain the difference between git merge and git rebase, and when to use each.
Ans: git merge creates a merge commit combining two branches, preserving history. git rebase replays commits from one branch onto another, creating a linear history. Use merge for shared branches (main/develop) to preserve history. Use rebase for feature branches to keep history clean. Example: on feature branch, git rebase main before merging prevents merge commits. In production: teams often use merge for main branch for audit trail, rebase for feature branches.
Q2: How do you handle merge conflicts in Git?
Ans: When conflicts occur, edit the conflicted files to resolve them manually. Git marks conflicts with <<<<, ====, >>>>. After resolving, use git add file.txt and git commit. Example: in a real scenario, two developers modify the same function, causing a conflict. You’ll see both versions and manually choose which to keep or merge them. Use git mergetool for graphical resolution or git diff to understand changes.
Q3: What is git stash and when would you use it?
Ans: git stash temporarily saves uncommitted changes without committing. Use git stash save "message", git stash list to see stashes, and git stash pop to restore. Real scenario: you’re working on a feature, then suddenly need to switch to main branch to fix a critical bug. Stash your changes, switch branches, fix the bug, then pop the stash back. This prevents losing work.
Q4: Explain git cherry-pick and provide a real-world use case.
Ans: git cherry-pick commit-hash applies a specific commit from one branch to another. Real scenario: a bug fix is committed to develop branch but needs to be in the release branch immediately. Instead of merging all of develop (which has incomplete features), cherry-pick only the bug fix commit: git cherry-pick abc123. This is common in hotfix scenarios.
Q5: How do you set up and manage remote repositories and handle collaboration?
Ans: git remote add origin url connects to a remote. git push origin branch uploads commits, git pull origin branch downloads. For collaboration, use branches: each developer works on a feature branch, pushes to remote, and creates a pull request for review. Real scenario: multiple teams pushing to the same repo. Use branching strategy like Git Flow (main, develop, feature/*, release/, hotfix/) to manage releases and prevent conflicts.
More Insights: playwright interview questions
4. Jenkins
Q1: What is a Jenkins pipeline and what are the differences between Declarative and Scripted pipelines?
Ans: Jenkins Pipeline is a suite of plugins for implementing CI/CD workflows. Declarative pipeline uses structured syntax with predefined sections (pipeline, agent, stages, post). Scripted pipeline uses Groovy scripts for more flexibility. Example Declarative:
pipeline {
  agent any
  stages {
    stage('Build') {
      steps { sh 'mvn build' }
    }
  }
}
Real scenario: Use Declarative for standard workflows, Scripted for complex conditional logic.
Q2: How do you create a parameterized Jenkins job?
Ans: Add parameters in job configuration: string parameters, choice parameters, boolean parameters. Access them in scripts via ${PARAM_NAME} or $PARAM_NAME. Example: Create parameter ENVIRONMENT with choices (dev, staging, prod). In build step: deploy.sh ${ENVIRONMENT}. Real use: single job for deploying to multiple environments without creating separate jobs.

Q3: Explain Jenkins agents/nodes and why you’d use them.
Ans: Jenkins master schedules jobs, agents execute them. Agents are separate machines connected to master via SSH or JNLP. Tag agents by capabilities (docker, kubernetes, windows). In Jenkinsfile: agent { label 'docker' } runs job on Docker-capable node. Real scenario: main master stays stable, builds run on multiple agents, scaling horizontally as workload increases.
Q4: How do you set up webhook-triggered builds and what’s the benefit?
Ans: Webhook is an HTTP callback that triggers Jenkins when events occur in Git. Configure in GitHub/GitLab: Settings → Webhooks → Jenkins URL. When code is pushed, Git sends payload to Jenkins, triggering build immediately. Real scenario: developer pushes code → GitHub sends webhook → Jenkins automatically starts build and testing within seconds, faster than polling.
Q5: Describe a real-time CI/CD pipeline scenario using Jenkins.
Ans: Developer pushes code → webhook triggers Jenkins → Checkout code → Run tests → Build Docker image → Push to registry → Deploy to staging → Run smoke tests → Manual approval → Deploy to production. Pipeline stages:
stages {
  stage('Test') { steps { sh 'pytest' } }
  stage('Build') { steps { sh 'docker build -t app:$BUILD_NUMBER .' } }
  stage('Push') { steps { sh 'docker push registry/app:$BUILD_NUMBER' } }
  stage('Deploy Staging') { steps { sh 'kubectl apply -f staging.yaml' } }
  stage('Approval') { steps { input 'Deploy to Prod?' } }
  stage('Deploy Prod') { steps { sh 'kubectl apply -f prod.yaml' } }
}
Related Posts: api automation interview questions
5. Docker
Q1: Explain the difference between Docker images and containers, and how they relate to each other.
Ans: A Docker image is a blueprint (read-only template) containing application code, dependencies, and environment. A container is a running instance of that image (like a class vs object). Create image from Dockerfile, run containers from images. Multiple containers can run from same image. Example: one MySQL image can run 10 containers, each isolated from others. In production: build image once, run containers across different servers.
Q2: Write a simple Dockerfile and explain each instruction.
Ans:
FROM ubuntu:20.04
WORKDIR /app
COPY . .
RUN apt-get update && apt-get install -y python3
ENV APP_ENV=production
EXPOSE 8000
CMD ["python3", "app.py"]
FROM: base image. WORKDIR: sets directory. COPY: copies files. RUN: executes commands. ENV: sets variables. EXPOSE: documents port. CMD: default command. Real scenario: package Python app with dependencies, expose port, run in production.
Q3: How do you manage data persistence in Docker containers?
Ans: Containers are ephemeral; data is lost when stopped. Use volumes for persistence. Three types: named volumes (docker volume create mydata), bind mounts (map host directory), tmpfs mounts (in-memory). Example: docker run -v mydata:/app/data myimage persists /app/data to named volume. Real scenario: database container needs persistent storage; use volume so data survives container restarts.
Q4: Explain Docker networking and how containers communicate.
Ans: Docker creates networks for container communication. Bridge network (default): containers on same host communicate via IP. Overlay network: containers on different hosts communicate (Swarm/Kubernetes). Example: docker network create mynet, docker run --network mynet --name web myimage, docker run --network mynet --name db dbimage. Container “web” reaches “db” via hostname. Real scenario: multi-container app (web, database, cache) runs isolated in custom network.
Q5: Describe a production scenario with multi-stage builds and optimization.
Ans: Multi-stage builds reduce final image size. First stage builds app, second stage copies only necessary artifacts:
FROM golang:1.19 AS builder
WORKDIR /app
COPY . .
RUN go build -o myapp

FROM alpine:latest
WORKDIR /app
COPY --from=builder /app/myapp .
CMD ["./myapp"]
First stage is large (includes build tools), second stage only has binary + alpine (tiny). Real scenario: build 1GB image with all tools, final image is 50MB with only runtime. Reduces deployment time and security surface.
You Should Also Read: Epam interview questions
6. Kubernetes
Q1: Explain the basic architecture of Kubernetes and its core components.
Ans: Kubernetes (K8s) is an orchestration platform. Master nodes contain: API Server (handles requests), Scheduler (assigns pods), Controller Manager (maintains state). Worker nodes contain: Kubelet (runs containers), kube-proxy (networking). Pods are smallest unit (one/multiple containers). Real scenario: 100 microservices running, K8s automatically restarts failed pods, scales based on load, handles rolling updates.
Q2: What is a Kubernetes Pod and how does it differ from a container?
Ans: Pod is smallest K8s unit, wraps one/multiple tightly-coupled containers sharing network. All containers in pod share IP and localhost. Containers outside pod need service to communicate. Example: main app + logging sidecar in one pod, both share localhost:8000. Real scenario: tightly-coupled services run in one pod, independent services run in separate pods.

Q3: Explain Kubernetes Services and the different types available.
Ans: Service exposes pods to internal/external traffic. Types: ClusterIP (internal only, default), NodePort (exposes on each node’s port), LoadBalancer (external load balancer). Example:
apiVersion: v1
kind: Service
metadata:
  name: my-service
spec:
  type: LoadBalancer
  selector:
    app: myapp
  ports:
  - protocol: TCP
    port: 80
    targetPort: 8000
Real scenario: deploy web app, create LoadBalancer service to route external traffic to pods.
Q4: How do you manage configuration and secrets in Kubernetes?
Ans: ConfigMap stores non-sensitive data (config files), Secret stores sensitive data (passwords, tokens). Example ConfigMap:
apiVersion: v1
kind: ConfigMap
metadata:
  name: app-config
data:
  database_host: "db.example.com"
Pod references: valueFrom: configMapKeyRef. Real scenario: change app config without rebuilding image, store database passwords securely in Secrets, avoid hardcoding.
Q5: Describe a real-time Kubernetes deployment scenario with auto-scaling and rolling updates.
Ans: Deploy 5 replicas of app. Create Deployment:
apiVersion: apps/v1
kind: Deployment
metadata:
  name: myapp
spec:
  replicas: 5
  selector:
    matchLabels:
      app: myapp
  template:
    spec:
      containers:
      - name: app
        image: myapp:v1
Setup HPA (Horizontal Pod Autoscaler): if CPU > 70%, scale to max 10 pods. Real scenario: traffic spike → HPA scales to 10 pods → handles load. Traffic decreases → scales back to 5. New version released → kubectl set image deployment/myapp myapp=myapp:v2 triggers rolling update (new pods start, old pods terminate gradually, zero downtime).
Also, Know More About: api testing interview questions
7. Alert Manager
Q1: What is Alertmanager and how does it differ from Prometheus?
Ans: Prometheus scrapes metrics and evaluates alert rules. Alertmanager receives alerts from Prometheus and handles routing, grouping, deduplication, and notifications. Prometheus is metric collection, Alertmanager is alert management. Real scenario: Prometheus fires “HighCPU” alert, Alertmanager groups similar alerts, deduplicates duplicates, sends to Slack/PagerDuty, silences during maintenance.
Q2: How do you configure alert routing in Alertmanager?
Ans: Configure routes in alertmanager.yml:
route:
  receiver: 'default'
  routes:
  - match:
      severity: critical
    receiver: 'pagerduty'
  - match:
      severity: warning
    receiver: 'slack'
receivers:
- name: 'default'
  slack_configs:
  - api_url: 'YOUR_SLACK_URL'
- name: 'pagerduty'
  pagerduty_configs:
  - service_key: 'YOUR_KEY'
Real scenario: critical alerts → PagerDuty (wake up oncall), warnings → Slack (notify team), info → email.

Q3: What is alert grouping and how do you implement it?
Ans: Grouping prevents alert storms by combining similar alerts. Group by labels in Alertmanager:
route:
  group_by: ['alertname', 'cluster']
  group_wait: 10s
  group_interval: 10s
  repeat_interval: 12h
group_by identifies similar alerts, group_wait waits before sending (accumulates alerts), group_interval wait between sends. Real scenario: 1000 pods with high CPU simultaneously → grouped into single alert instead of 1000 notifications.
Q4: Explain alert silencing and inhibition rules.
Ans: Silencing temporarily suppresses alerts. Inhibition prevents alerts when other alerts fire. Example: if “DatabaseDown” fires, inhibit “HighDatabaseLatency”:
inhibit_rules:
- source_match:
    alertname: 'DatabaseDown'
  target_match:
    alertname: 'HighDatabaseLatency'
  equal: ['instance']
Real scenario: during planned maintenance, silence alerts manually. When database crashes, inhibit latency alerts (they’re expected).
Q5: Describe a real-time alerting workflow with escalation.
Ans: Setup escalation policy:
route:
  group_by: ['alertname']
  group_wait: 5s
  routes:
  - match:
      severity: critical
    receiver: 'pagerduty'
    repeat_interval: 5m
  - match:
      severity: warning
    receiver: 'slack'
    repeat_interval: 1h
Real scenario: critical alert fires → PagerDuty notifies oncall engineer. No ack in 5 mins → escalates to backup. Warning fires → Slack notifies team. If not resolved in 1 hour → escalate to manager. This ensures issues are addressed timely.
Also, Explore: product based companies in chennai
8. Prometheus
Q1: Explain Prometheus architecture and how it collects metrics.
Ans: Prometheus is a time-series metrics database. Architecture: Prometheus server scrapes exporters/applications at intervals, stores in time-series database, evaluates alert rules. Pull model (vs Push). Example: scrape Kubernetes nodes every 30s via node-exporter. Real scenario: Prometheus scrapes 100 microservices, stores metrics with timestamp, enables time-series queries.
Q2: What are Prometheus metrics types and provide examples?
Ans: Four types: Counter (always increases, e.g., total requests), Gauge (up/down, e.g., temperature), Histogram (distribution, e.g., request duration buckets), Summary (like histogram but different). Examples: – Counter: http_requests_total{method="GET"} – Gauge: node_memory_available_bytes – Histogram: http_request_duration_seconds_bucket Real scenario: track API request count (counter), current CPU usage (gauge), response time distribution (histogram).
Q3: How do you write PromQL queries to extract metrics?
Ans: PromQL is Prometheus query language. Examples: – node_cpu_seconds_total (all CPU metrics) – rate(http_requests_total[5m]) (requests per second in last 5 mins) – topk(5, node_memory_available_bytes) (top 5 nodes by available memory) – node_memory_available_bytes > 1000000 (alert if memory low) Real scenario: query “API response time 95th percentile in last hour”, “CPU usage by pod”, “disk space available”.

Q4: Explain Prometheus scrape configuration and relabeling.
Ans: Scrape config in prometheus.yml:
scrape_configs:
- job_name: 'kubernetes'
  kubernetes_sd_configs:
  - role: pod
  metric_relabel_configs:
  - source_labels: [__name__]
    regex: 'go_.*'
    action: drop
This discovers pods, scrapes metrics, drops Go metrics. Real scenario: auto-discover new pods in Kubernetes, relabel metrics to add environment labels, drop high-cardinality metrics.
Q5: Describe a real-time monitoring scenario with Prometheus and recording rules.
Ans: Setup recording rules to pre-compute common queries:
groups:
- name: cpu
  interval: 30s
  rules:
  - record: 'instance:cpu:rate5m'
    expr: 'rate(node_cpu_seconds_total[5m])'
  - record: 'job:cpu:avg'
    expr: 'avg(instance:cpu:rate5m) by (job)'
Real scenario: query cpu:avg (pre-computed) instead of computing from raw metrics every time. Faster dashboards, reduced query load. If 500 microservices send metrics, recording rules average CPU by service, store result, Grafana dashboard displays pre-computed values instantly.
9. Grafana
Q1: What is Grafana and how does it integrate with Prometheus?
Ans: Grafana is a visualization platform for metrics/logs. It queries Prometheus API to retrieve metrics, displays in dashboards with graphs, tables, alerts. Example: add Prometheus data source in Grafana, create dashboard panel with query rate(http_requests_total[5m]), visualize as graph. Real scenario: operations team views production metrics, correlates events, identifies bottlenecks visually.
Q2: How do you create a Grafana dashboard and set up visualizations?
Ans: Create dashboard → add panels → select visualization (graph, gauge, heatmap). For each panel: set Prometheus query, configure axes/colors. Example panel:
Title: "API Response Time"
Query: histogram_quantile(0.95, rate(http_request_duration_seconds_bucket[5m]))
Visualization: Graph
Y-axis: Seconds
Alert: If > 500ms, fire alert
Real scenario: build dashboard showing API latency, database connections, error rate; operations team monitors production health.
Q3: Explain Grafana alerting and how to set thresholds.
Ans: In panel settings, add alert rule:
Condition: avg(B) > 80
For: 5 minutes
Send to: PagerDuty
Message: "CPU usage high"
If average CPU > 80% for 5 minutes, alert fires. Real scenario: CPU exceeds threshold for sustained 5 minutes (not spikes), alert fires to prevent false positives.
Q4: How do you create dashboard variables for dynamic filtering?
Ans: Add variables in dashboard settings. Example variable $instance with choices (prod-1, prod-2, prod-3). Use in queries: node_memory_available_bytes{instance="$instance"}. Dropdown allows team to switch instances without editing queries. Real scenario: single dashboard for monitoring 10 servers; select server from dropdown to view specific server metrics.

Q5: Describe a real-time monitoring dashboard scenario.
Ans: Build production dashboard for operations team: – Panel 1: API request rate (line graph) – Panel 2: Error rate percentage (gauge) – Panel 3: CPU usage by service (bar chart) – Panel 4: Database connections (stat) – Panel 5: Disk space (gauge) Variables: $service, $environment Queries use variables: rate(http_requests_total{service="$service"}[5m]) Team selects service/environment from dropdowns, sees all metrics update. Set alert: if error rate > 5% for 2 mins, page oncall. Real-time visibility into application health enables quick incident response.
10. SonarQube
Q1: What is SonarQube and what does it analyze in code?
Ans: SonarQube is a code quality and security analysis platform. Analyzes: bugs, code smells, vulnerabilities, code coverage, duplications, complexity. Generates reports with ratings (A-E). Real scenario: developer commits code, CI pipeline triggers SonarQube scan, detects SQL injection vulnerability, blocks merge, developer fixes, re-runs scan, passes.
Q2: How do you integrate SonarQube with Jenkins CI/CD pipeline?
Ans: Install SonarScanner plugin, configure SonarQube server in Jenkins. In Jenkinsfile:
stage('SonarQube Scan') {
  steps {
    withSonarQubeEnv('SonarQube') {
      sh 'sonar-scanner \
        -Dsonar.projectKey=myproject \
        -Dsonar.sources=src \
        -Dsonar.java.binaries=build'
    }
  }
}
stage('Quality Gate') {
  steps {
    waitForQualityGate abortPipeline: true
  }
}
Real scenario: build → test → SonarQube scan → if quality gate fails, stop pipeline; developer must fix code quality before merging.
Q3: What is the Quality Gate and how do you configure it?
Ans: Quality Gate defines pass/fail criteria. Configure in SonarQube: – Code coverage < 80% → FAIL – Bugs > 5 → FAIL – Security issues > 0 → FAIL – Complexity > 15 → FAIL Example: run SonarQube, if any condition fails, Quality Gate fails, CI pipeline stops. Real scenario: enforce standards; no code merges without 80% coverage or if it has security issues. Prevents technical debt accumulation.
Q4: How do you set up code coverage analysis in SonarQube?
Ans: Generate coverage reports from test frameworks (JaCoCo for Java, pytest for Python). Example with Maven:
mvn clean test jacoco:report
SonarQube detects coverage report (target/site/jacoco/jacoco.xml), analyzes coverage percentage. In SonarQube dashboard: shows covered/uncovered lines, coverage trend. Real scenario: track coverage over time, identify untested code, set threshold (>80%), fail builds if below.
Q5: Describe a real-time code quality workflow in production CI/CD.
Ans: Developer commits code: 1. Jenkins triggers build 2. Run unit tests with coverage (pytest/Maven) 3. SonarQube scans code for bugs/vulnerabilities 4. Check Quality Gate: if code coverage < 80% OR bugs detected → FAIL, send feedback to developer 5. If passes: merge to main, run integration tests 6. Deploy to staging/production

Real scenario: 10 developers commit daily. SonarQube prevents low-quality code merging. Dashboard shows quality trends: Nov avg coverage 75%, target 85%, identify which modules lack tests. Security scan catches SQL injection before production. Code smell report suggests refactoring complex functions (complexity > 15). Team improves code quality incrementally through automated gates.
Conclusion
These DevOps interview questions for 2026 cover every essential topic — from Linux and shell scripting to CI/CD, Docker, Kubernetes, and cloud monitoring. They reflect what top employers look for in today’s DevOps engineers: problem-solving skills, automation mindset, and hands-on experience across modern toolchains.
To advance your career, explore online courses for DevOps that focus on real-world projects, CI/CD pipelines, and cloud infrastructure. Continuous learning and practice are the keys to staying relevant in 2026’s fast-evolving DevOps landscape.
FAQs
Q1: What are the top DevOps skills to learn in 2026?
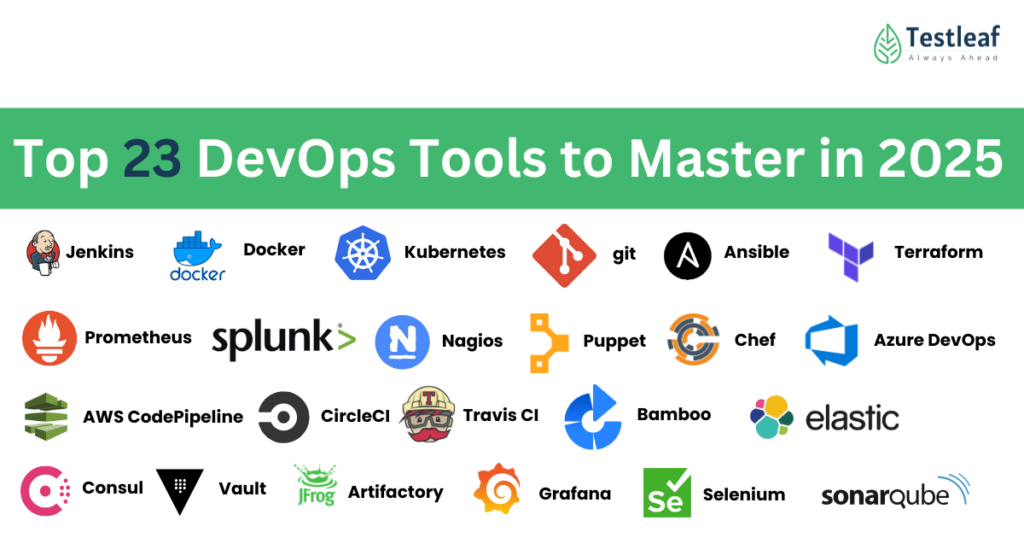
Focus on Kubernetes, Jenkins, Docker, cloud automation, Terraform, and observability tools like Prometheus and Grafana.
Q2: Is DevOps still in demand in 2026?
Absolutely! With AI-driven pipelines and hybrid cloud adoption, DevOps remains one of the top 3 highest-paying tech careers in 2026.
Q3: How can I gain real-time DevOps experience?
Work on CI/CD projects, containerize applications, deploy them on Kubernetes, and integrate monitoring using Prometheus and Grafana.
Q4: What’s the best certification for DevOps in 2026?
Certifications like AWS Certified DevOps Engineer, Docker Certified Associate, and Testleaf’s DevOps Masterclass are highly valued.
Q5: How can I start learning DevOps from scratch?
Start with Git, Linux, Jenkins, and Docker basics — then progress to Kubernetes, Prometheus, and CI/CD pipelines through Testleaf’s hands-on DevOps program.
We Also Provide Training In:
Author’s Bio:

Content Writer at Testleaf, specializing in SEO-driven content for test automation, software development, and cybersecurity. I turn complex technical topics into clear, engaging stories that educate, inspire, and drive digital transformation.
Ezhirkadhir Raja
Content Writer – Testleaf
![]()