Introduction
Ever had a test that passes on your machine but fails during continuous integration (CI)?
You try adding console.log() or a waitForTimeout(5000) hoping for the best—but it still fails. This is the reality of flaky tests, and it wastes time without fixing the root cause.
That’s where Playwright Inspector shines—it’s a visual debugging tool that lets you pause tests, inspect live elements, and fix issues step by step.
In this guide, you’ll learn how to use Playwright Inspector effectively—through a free Playwright tutorial filled with practical tips, real-world debugging examples, and best practices we follow at Testleaf to help testers build reliable, maintainable automation scripts.
The Debugging Struggle is Real
We’ve all hit this wall:
-
A test that randomly fails in CI but works fine locally.
-
You add arbitrary waits like
waitForTimeout(5000), only making tests slower. -
Hours pass while you try to “guess” the failure point.
Playwright Inspector removes this guesswork by showing what’s happening, step by step.
Popular Articles: infosys interview questions for automation testing
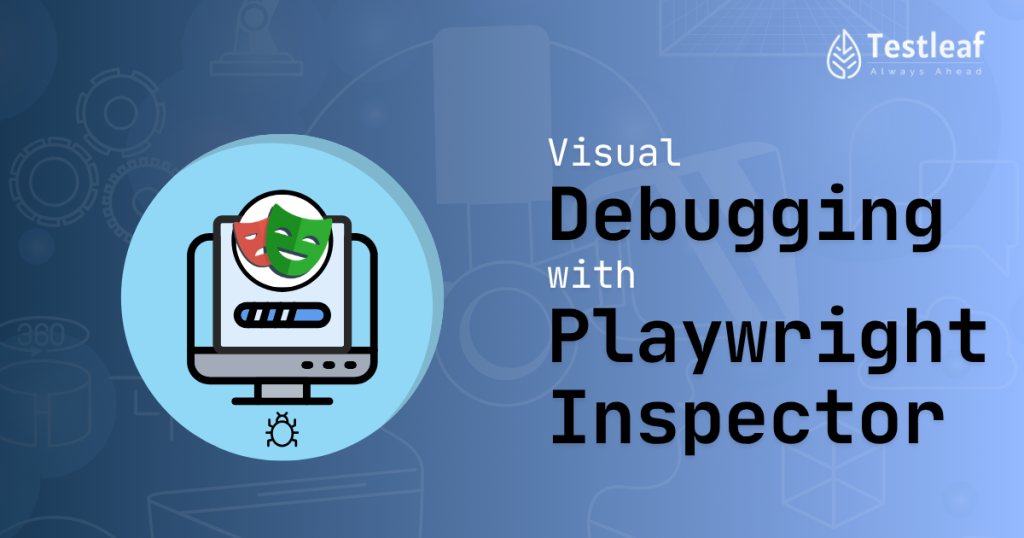
What is Playwright Inspector?
Playwright Inspector is a graphical debugging tool that:
- Pauses test execution at each step
- Highlights the current line being executed
- Lets you inspect live DOM elements
- Allows selector testing in real time
- Supports modifying & re-running tests on the fly
- Think of it as Chrome DevTools + Test Runner, but built specifically for Playwright.

How to Launch Playwright Inspector
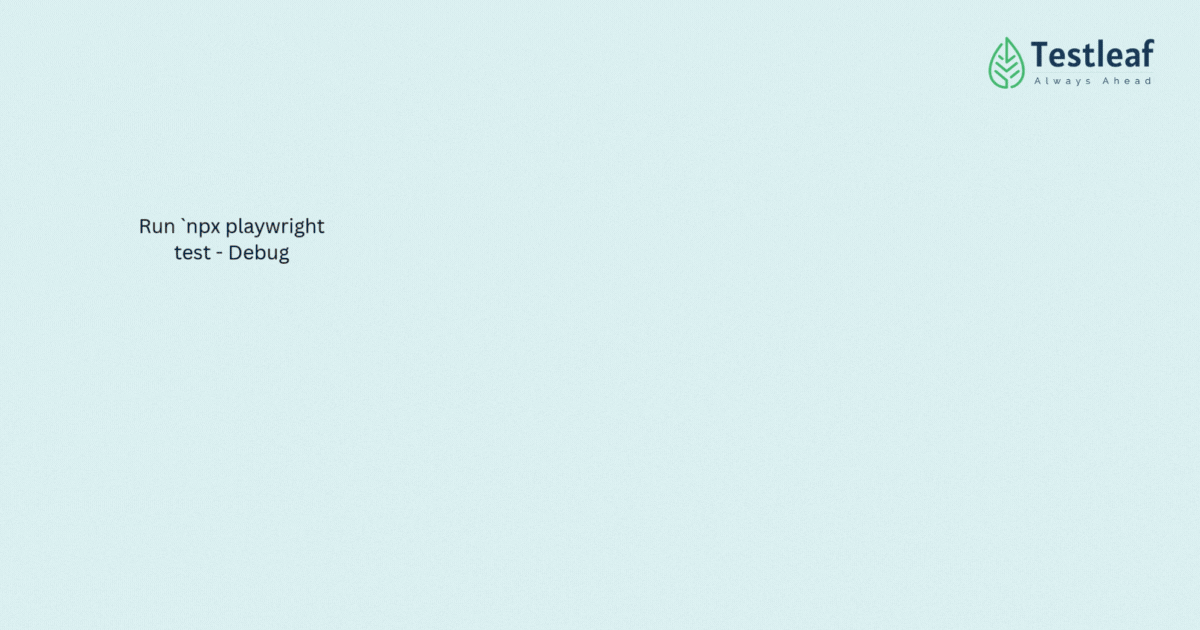
Method 1: Debug Mode
Run tests with `–debug` to open Inspector:
npx playwright test –debug
Method 2: Environment Variable
Set `PWDEBUG=1` to debug a specific test:
PWDEBUG=1 npx playwright test tests/login.spec.ts
Method 3: Manual Pause
Insert `await page.pause()` anywhere in your test to trigger Inspector:
test(‘Login Test’, async ({ page }) => {
await page.goto(‘/login’);
await page.pause(); // Opens Inspector here
await page.fill(‘#email’, ‘test@example.com’);
});
You Should Also Read: Top 10 Service-Based IT Companies in Chennai
Why Playwright Inspector is a Game-Changer
Unlike `console.log()` debugging, Inspector gives you:
- Live DOM inspection at every step
- Real-time locator evaluation (test selectors instantly)
- Execution control (Play, Step Over, Stop)
- No restarts needed—edit code and resume debugging
Example: Debugging a Flaky Login Test
Consider this failing test:
test(‘User Login’, async ({ page }) => {
await page.goto(‘/login’);
await page.fill(‘#email’, ‘user@example.com’);
await page.fill(‘#password’, ‘wrongpassword’);
await page.click(‘#loginBtn’);
await expect(page.locator(‘.error’)).toBeVisible();
});

Debugging Steps
- Run `npx playwright test –debug`
- Watch each step execute in the browser
- Pause before `click()` to check if the button is clickable
- Inspect`.error` element to see if it appears
- Modify selectors live if needed
Instead of guessing, you see exactly where the test fails.
Pro Tips for Effective Debugging
1. Run Tests in Headful Mode
Force visible browser execution for better debugging:
// In playwright.config.ts
test.use({ headless: false });
2. Highlight Locators for Visibility
Temporarily highlight elements to verify selectors:
await page.locator(‘#loginBtn’).highlight(); // Flashes the element
3. Record Traces for CI Debugging
Capture execution traces for later analysis:
npx playwright test –trace on
4. Use `–slowmo` to Slow Down Execution
Make test steps easier to follow:
npx playwright test –slowmo 1000

Beyond Debugging: Other Uses for Inspector
Playwright Inspector isn’t just for fixing bugs—it also helps:
- Writing new tests interactively
- Teaching automation concepts to junior testers
- Validating locators before adding them to scripts
- Reproducing CI failures locally
Conclusion
Debugging doesn’t have to be frustrating or slow. With Playwright Inspector, you gain real-time visibility into each step of your test—so you can fix flaky issues without relying on blind waits or excessive logging.
Whether you’re just getting started with software testing using Playwright or mentoring junior testers, this tool is a must-have in your workflow. It empowers you to:
-
See exactly what’s happening in your browser
-
Instantly test and tweak selectors
-
Write more stable, maintainable tests
At Testleaf, we use tools like Playwright Inspector in our hands-on training programs to teach automation the right way—from debugging to deployment.
Stop using waitForTimeout() as a crutch. Start debugging with confidence.
Ready to Master Playwright Automation?
Want to go beyond debugging and become confident in real-world test automation?
Join our Playwright course online at Testleaf—designed for both beginners and experienced testers looking to level up in Playwright automation.
- Learn from industry experts
- Get hands-on projects & real-time debugging practice
- Build robust test suites with CI/CD integration
Start your journey into Playwright the right way.
Explore the course now and transform the way you test.
We Also Provide Training In:
- Advanced Selenium Training
- Playwright Training
- Gen AI Training
- AWS Training
- REST API Training
- Full Stack Training
- Appium Training
- DevOps Training
- JMeter Performance Training
Author’s Bio:

As a Senior SDET, I’m passionate about advancing the field of test automation by equipping teams with real-time solutions and high-impact frameworks. With over 8 years of experience in software testing and development, I specialize in building scalable automation platforms that ensure quality at speed. I’m committed to mentoring aspiring engineers and driving innovation through continuous learning and technical excellence. Let’s shape the future of quality engineering—together.
Dilipkumar Rajendran
Senior SDET | Playwright & Selenium Expert
![]()