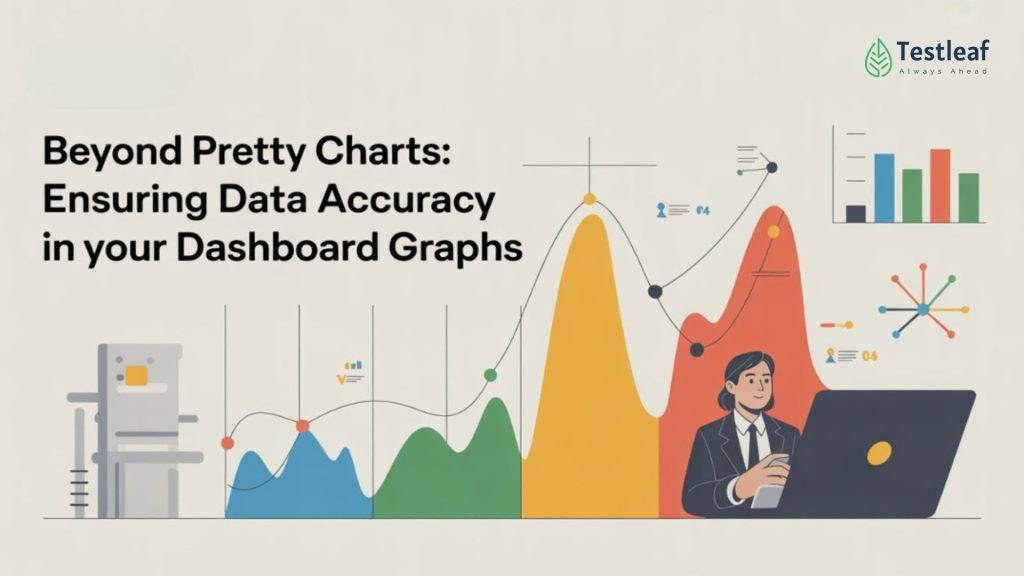
In today’s data-driven world, dashboards have become the central nervous system of decision-making. Executives rely on them to allocate budgets, product managers use them to track feature adoption, and operations teams use them to detect anomalies before they become disasters. But a dashboard’s value is only as strong as its integrity. A beautiful graph with incorrect data is worse than having no graph at all — it can push an organization toward poor decisions with misplaced confidence. This is where the discipline of visualization integrity steps in: the practice of verifying that every bar, line, and pie slice reflects the truth of the underlying data.
The High Stakes of Visual Data Integrity
Visual data integrity is not just a technical problem; it’s a business risk. Consider a retail company misreporting its sales numbers because of a timezone mismatch in its ETL pipeline. A false spike might lead to overstocking, wasted capital, and markdowns. A dip might trigger unnecessary layoffs. According to a report by KPMG, poor quality data can cost companies an average of 15% to 25% of their revenue due to operational inefficiencies and erroneous decision-making. The implications extend beyond profit: in healthcare, inaccurate dashboards could delay treatment; in finance, they could cause compliance violations.
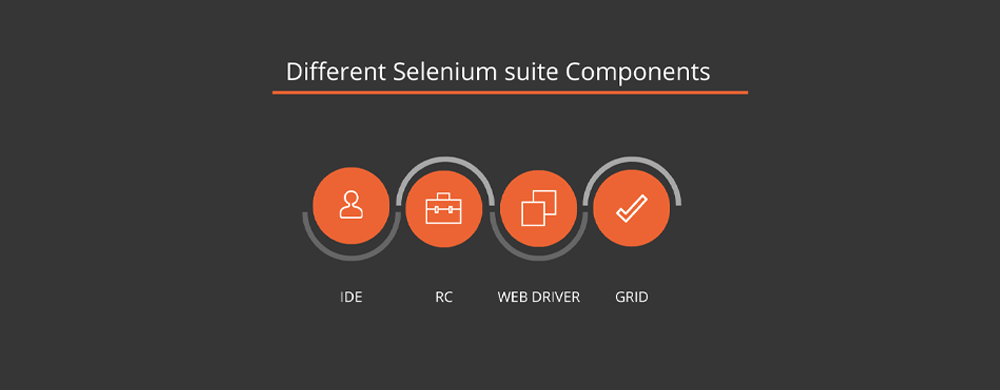
Continue Reading: selenium interview questions
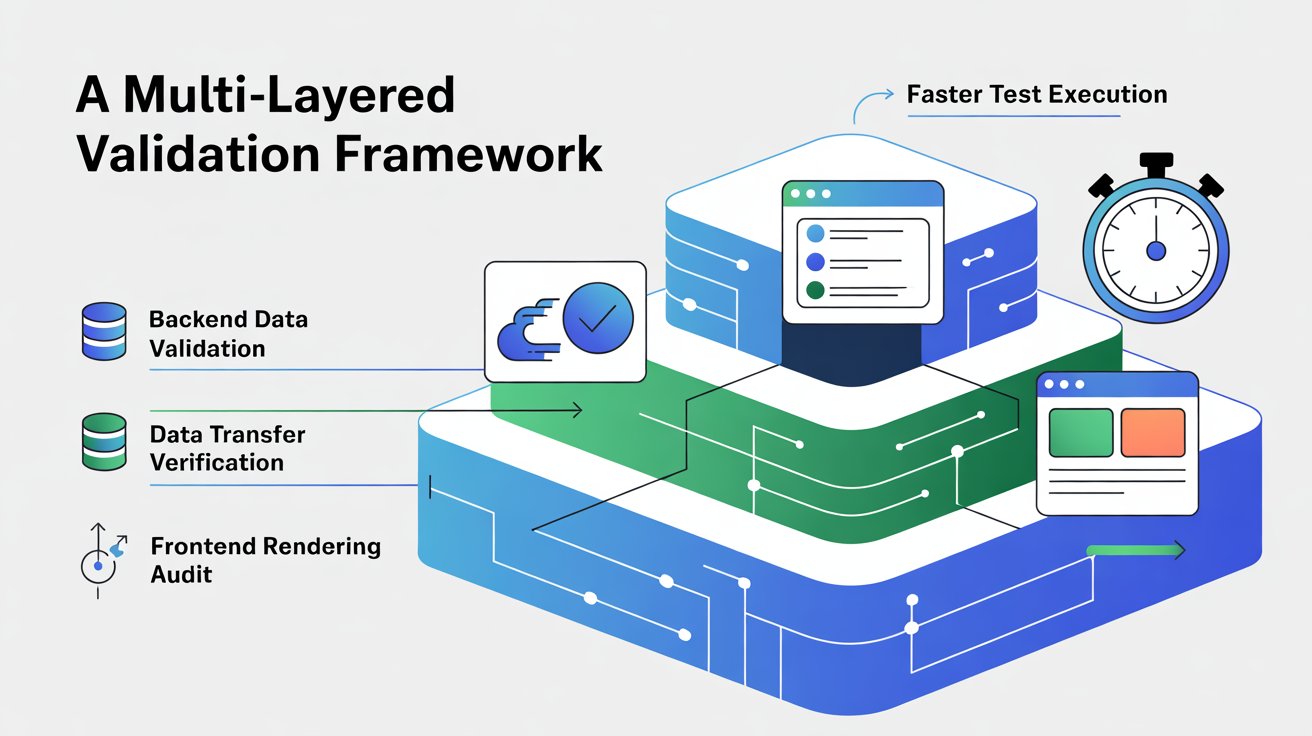
A Multi-Layered Validation Framework
The best way to achieve trustworthy dashboards is to think of validation as a layered defense system. Each layer verifies a different aspect of the pipeline and together they form a robust net for catching discrepancies.
Layer 1: Backend Data Validation
The journey begins at the data source — the database, event store, or warehouse. This is where you confirm that your raw data is accurate, complete, and free from duplication.
– Write SQL assertions to recompute aggregates and compare them with historical baselines.
– Validate data integrity constraints: no nulls in required fields, no duplicate keys.
– Snapshot transformation outputs to enable reproducibility when investigating discrepancies.

Layer 2: Data Transfer Verification
Once the data leaves the backend, its journey is not done. API responses can be truncated, fields renamed, or caching layers can serve stale results. Contract testing is critical here.
– Assert API schemas and field types using contract tests.
– Use controlled test data in staging to make results deterministic.
– Compare API aggregates against recomputed database queries.
Layer 3: Frontend Rendering Audit
Even if the backend is perfect, rendering bugs can still mislead users. Bars can be scaled incorrectly, axes can be truncated, or tooltips can display rounded numbers that no longer match the database.
– Extract data directly from the chart library in the browser using JavaScript.
– Compare extracted numbers against API or DB results.
– Automate tooltip hovers for charts that reveal values only on interaction.
The Automation Advantage: Selenium as a Validation Tool
Manual testing might catch glaring issues, but automated checks provide repeatability and coverage at scale. Selenium combined with JavaScript execution is a powerful way to validate chart data because it allows you to query live chart objects in the browser and assert values programmatically.
Practical Implementation with Selenium-Java
Below is a production-grade example that demonstrates how to extract data points from a Highcharts-based visualization and validate them. This approach is adaptable to Chart.js, D3, and other libraries with similar APIs.
import org.openqa.selenium.JavascriptExecutor;
import org.openqa.selenium.WebDriver;
import org.openqa.selenium.chrome.ChromeDriver;
import org.testng.Assert;
import org.testng.annotations.AfterClass;
import org.testng.annotations.BeforeClass;
import org.testng.annotations.Test;import java.util.ArrayList;
import java.util.List;
import java.util.Map;public class GraphDataValidationTest {
WebDriver driver;
@BeforeClass
public void setUp() {
driver = new ChromeDriver();
driver.manage().window().maximize();
}@Test
public void validateGraphData() {
driver.get(“https://www.worldometers.info/coronavirus/”);JavascriptExecutor js = (JavascriptExecutor) driver;
// Extract Highcharts data points from the first chart
List<Map<String, Object>> points = (List<Map<String, Object>>) js.executeScript(
“return Highcharts.charts[0].series[0].data.map(p => ({x: p.x, y: p.y}));”);System.out.println(“Extracted Graph Data Points: “);
for (Map<String, Object> point : points) {
System.out.println(“X: ” + point.get(“x”) + “, Y: ” + point.get(“y”));
}// Basic Validation: Ensure we have data points
Assert.assertTrue(points.size() > 0, “Graph has no data points!”);// You could compare `point.get(“y”)` with API/DB values here
// Example pseudo-assertion:
// double expectedValue = fetchFromAPI();
// Assert.assertEquals(points.get(points.size()-1).get(“y”), expectedValue);
}@AfterClass
public void tearDown() {
if (driver != null) {
driver.quit();
}
}
}
Advanced Challenges & Solutions
Dynamic dashboards with streaming data and canvas-based rendering add complexity. For these, prefer comparing API data rather than attempting pixel-based extraction. Introduce fixture modes where possible so that test runs see a frozen snapshot of data.

Balancing Visual and Numeric Validation
Numeric validation is the gold standard for data fidelity, but visual regression testing catches layout regressions. A healthy strategy blends both: numbers ensure truth, screenshots ensure presentation quality.
Recommended for You: automation testing interview questions
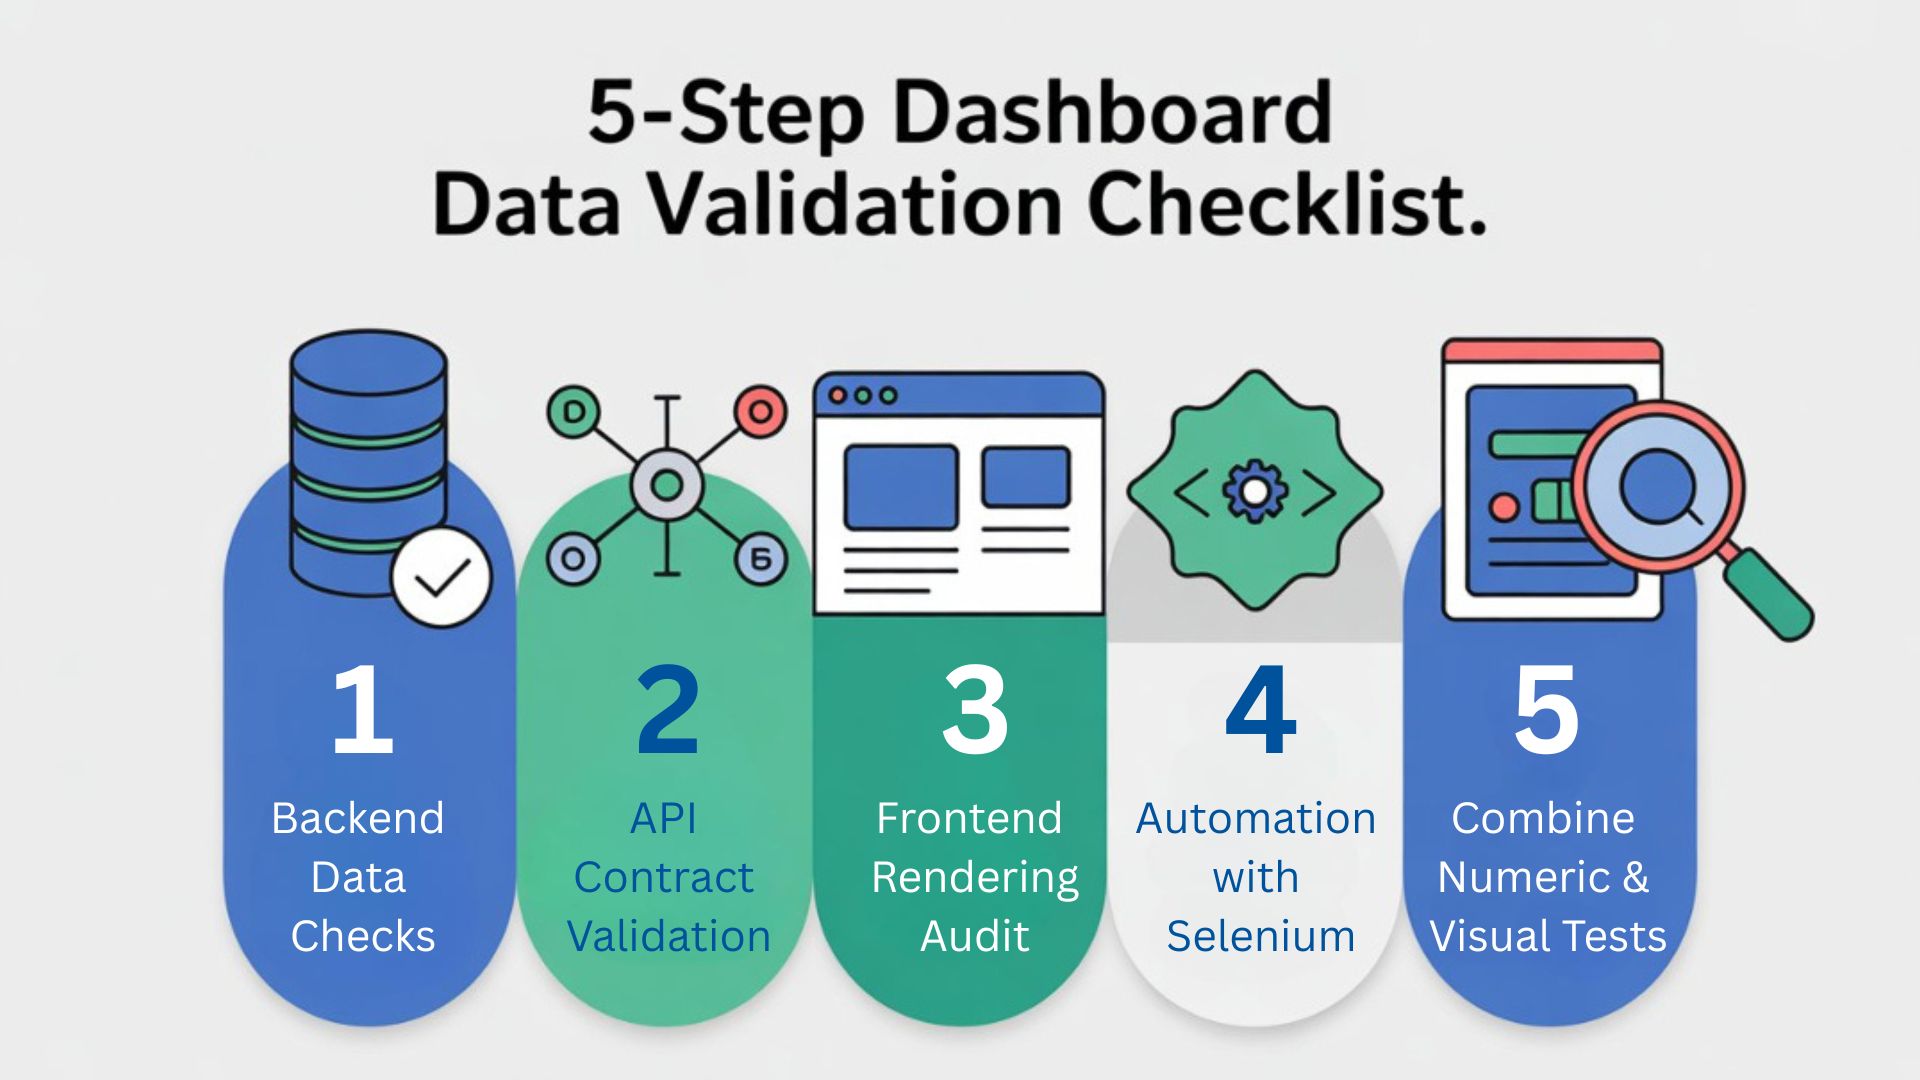
5-Step Dashboard Data Validation Checklist
-
Backend Data Checks
-
Verify raw data accuracy with SQL queries.
-
Ensure no nulls, duplicates, or broken keys.
-
-
API Contract Validation
-
Test schema, field types, and responses.
-
Compare API aggregates with database queries.
-
-
Frontend Rendering Audit
-
Extract values directly from chart libraries.
-
Cross-check UI values with API/DB sources.
-
-
Automation with Selenium
-
Use Selenium + JavaScript to extract chart data.
-
Automate tooltip hovers and data validations.
-
-
Combine Numeric & Visual Tests
-
Numeric checks = accuracy.
-
Visual regression tests = UI consistency.
-
Conclusion: Trust, Transparency, and Repeatability
Dashboards should not just dazzle — they should tell the truth. A rigorous, layered validation strategy backed by automation ensures that every stakeholder sees a faithful representation of reality. By combining backend checks, API contract validation, and UI-level verification, you can transform your dashboards from pretty pictures into reliable decision engines.
FAQs
Q1. Why is dashboard data validation important?
Because incorrect charts can lead to poor business decisions, compliance risks, and financial loss. Validation ensures reliability and trust in analytics.
Q2. How do you validate data accuracy in dashboards?
By using a layered approach: backend checks, API contract testing, and frontend rendering audits. Automation tools like Selenium help verify live charts.
Q3. What tools are best for automated dashboard validation?
Popular tools include Selenium, Playwright, Cypress, and API testing frameworks like Postman or REST Assured.
Q4. Can Selenium validate chart data?
Yes. Selenium with JavaScript can extract values from chart libraries (Highcharts, Chart.js, D3) and compare them against backend or API sources.
Q5. How do you balance visual vs. numeric validation in dashboards?
Numeric checks ensure data accuracy, while visual regression testing ensures the UI looks correct. Together they provide full dashboard validation.
We Also Provide Training In:
- Advanced Selenium Training
- Playwright Training
- Gen AI Training
- AWS Training
- REST API Training
- Full Stack Training
- Appium Training
- DevOps Training
- JMeter Performance Training
Author’s Bio:

As a Senior SDET with 8+ years in testing and development, I build scalable automation platforms ensuring quality at speed. Passionate about mentoring and innovation, I equip teams with real-time solutions and high-impact frameworks, driving excellence through continuous learning. Let’s shape the future of quality engineering together.
Dilipkumar Rajendran
Senior SDET | Playwright & Selenium Expert
![]()