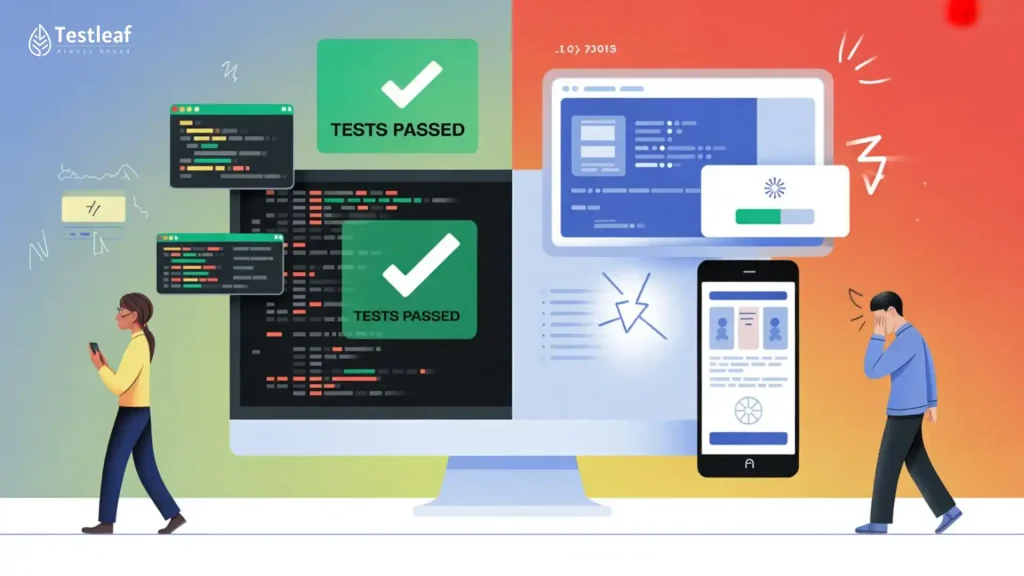
Most QA teams celebrate green test reports.
But here’s the uncomfortable truth:
Passing tests don’t guarantee a good user experience.
A checkout flow can pass every Selenium test…
…and still lose revenue because it feels slow.
This gap — between “working” and “performing well” — is where modern QA needs to evolve.
At Testleaf, we see this shift clearly:
Automation is no longer just about correctness.
It is about confidence, speed, and user experience.
And that is where performance signals inside Selenium workflows become a powerful differentiator.
Why do Selenium tests pass but users still leave?
Selenium tests focus on functionality, not performance. Even if flows work, slow load times, rendering delays, and poor user experience can still cause users to drop off.
How can Selenium detect performance issues?
Selenium can capture performance signals like page load time, browser logs, and Lighthouse scores to detect slowdowns and user experience issues early in CI pipelines.
Functional Testing Is Not Enough Anymore
Let’s take a realistic scenario:
- Login works
- Dashboard loads
- Filters apply correctly
But:
- Page load increases from 2 seconds to 5 seconds
- A third-party script delays rendering
- UI interactions feel sluggish
Your automation suite still passes.
But your users don’t stay.
According to industry research, even a 1-second delay in load time can reduce conversions by up to 20 percent. That means performance is not just a technical metric — it is a business metric.
Yet most Selenium test suites are blind to this.
Additional Resources: manual testing interview questions
Functional vs Experience Testing
| Approach | Focus | Outcome |
|---|---|---|
| Functional testing | Pass/Fail validation | Features work |
| Experience testing | Speed + responsiveness | Users stay engaged |
| Traditional QA | Bug detection | Reactive fixes |
| Modern QA | Performance signals | Proactive detection |
The Shift: From Test Automation to Experience Assurance
Modern QA is undergoing a mindset shift:
| Traditional QA | Modern QA |
| Does it work? | Does it work fast enough? |
| Pass / Fail | Performance signals |
| Functional coverage | Experience confidence |
| Reactive testing | Proactive detection |
This is where Selenium becomes more powerful than most teams realize.
Not as a load testing tool, but as a real-user performance signal collector.


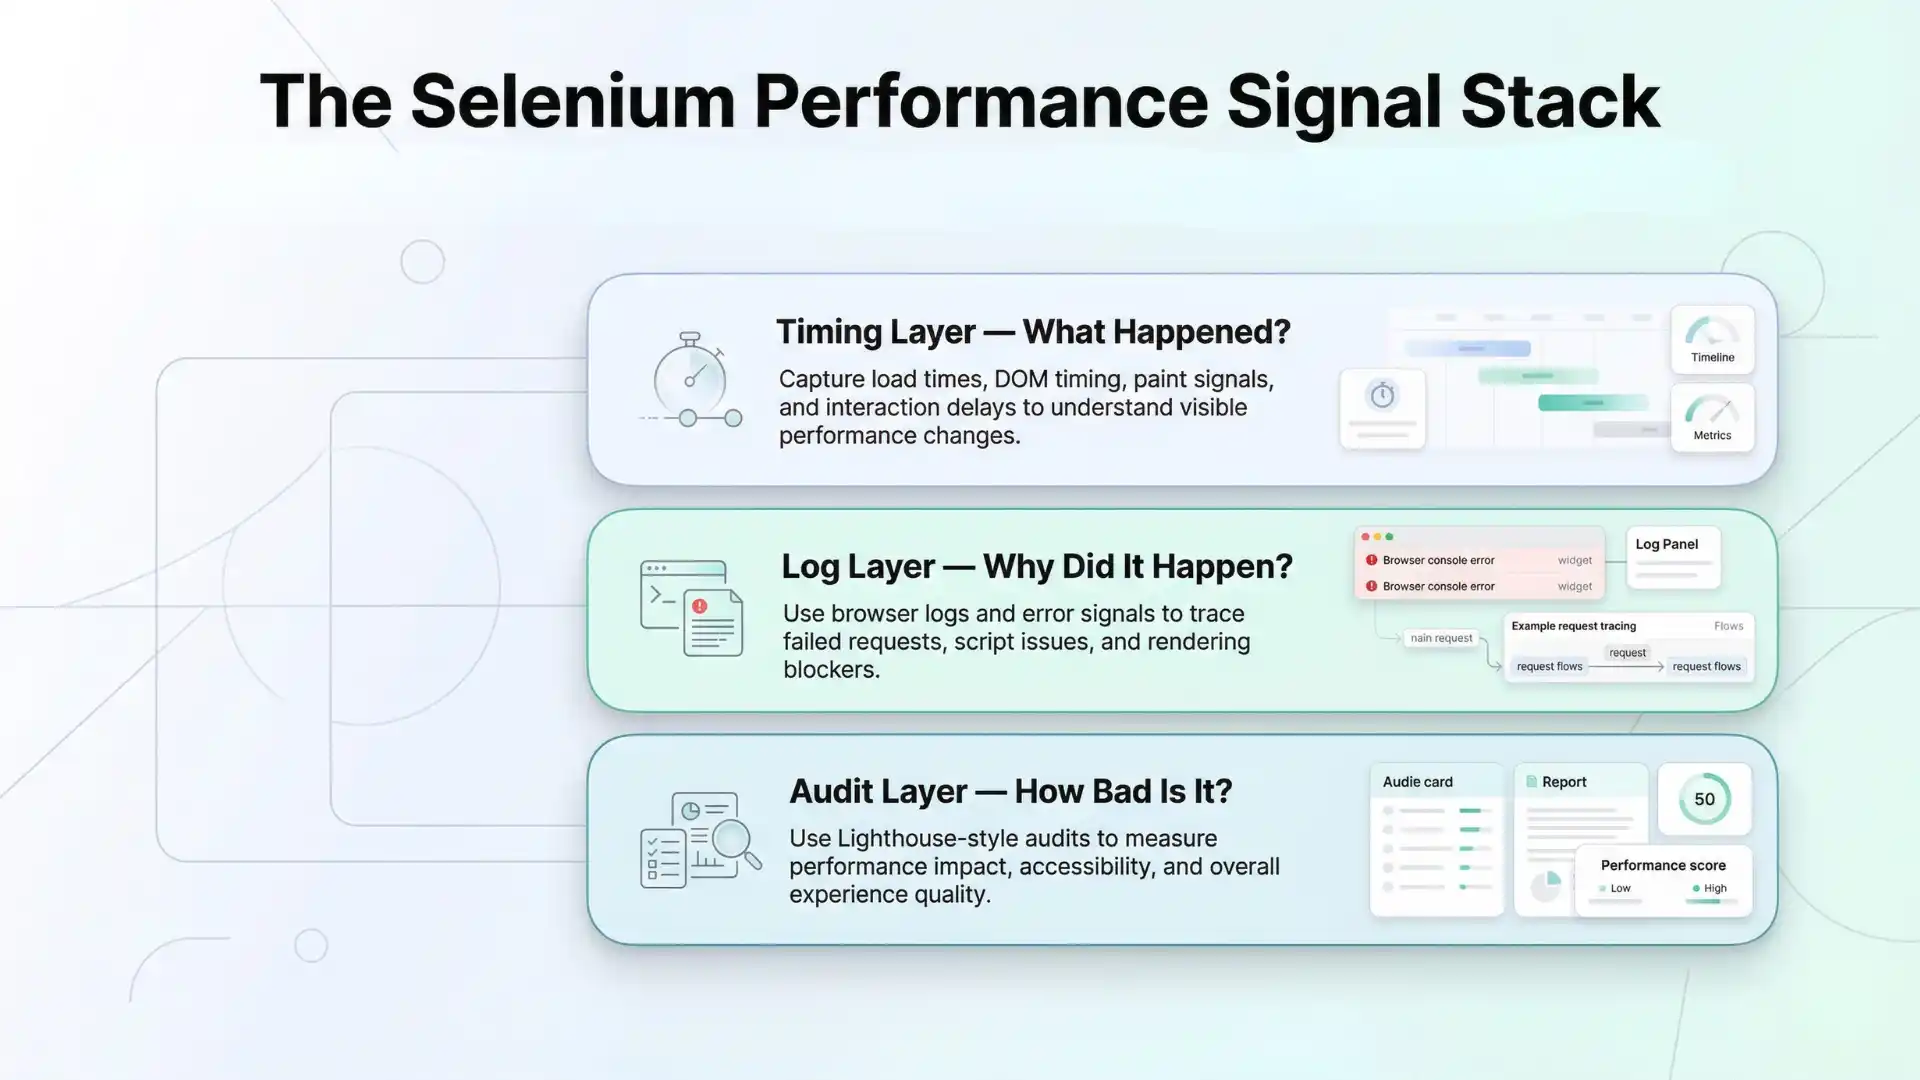
The Selenium Performance Signal Stack
To make this actionable, let’s break it into a simple framework:
1. Timing Layer — What Happened?
Modern browsers expose performance data via APIs.
Using Selenium, you can capture:
- Page load time
- DOMContentLoaded
- First paint / First Contentful Paint
- API and resource timing
Example:
JavascriptExecutor js = (JavascriptExecutor) driver;

Object loadTime = js.executeScript(
  "return performance.timing.loadEventEnd - performance.timing.navigationStart;"
);
This gives you baseline performance visibility during real user flows.
2. Log Layer — Why Did It Happen?
Performance issues rarely appear without clues.
Browser logs can reveal:
- JavaScript errors blocking rendering
- Failed API calls causing retries
- Slow-loading assets
- Third-party script issues
These are not just logs — they are root cause signals.
For example, a page slowdown might be traced back to a failing analytics script retrying multiple times. Without logs, this insight remains invisible.
3. Audit Layer — How Bad Is It?
This is where tools like Lighthouse come in.
A practical approach:
- Use Selenium to navigate (login, dashboard, etc.)
- Run Lighthouse on the same page
- Compare performance scores over time
Measure:
- Performance score
- Accessibility
- Best practices
- Core Web Vitals

Now you are not guessing — you are measuring impact.
What performance signals can Selenium capture?
- Page load time
- DOMContentLoaded timing
- First Contentful Paint
- API and resource timing
- Browser console errors
- Lighthouse performance scores
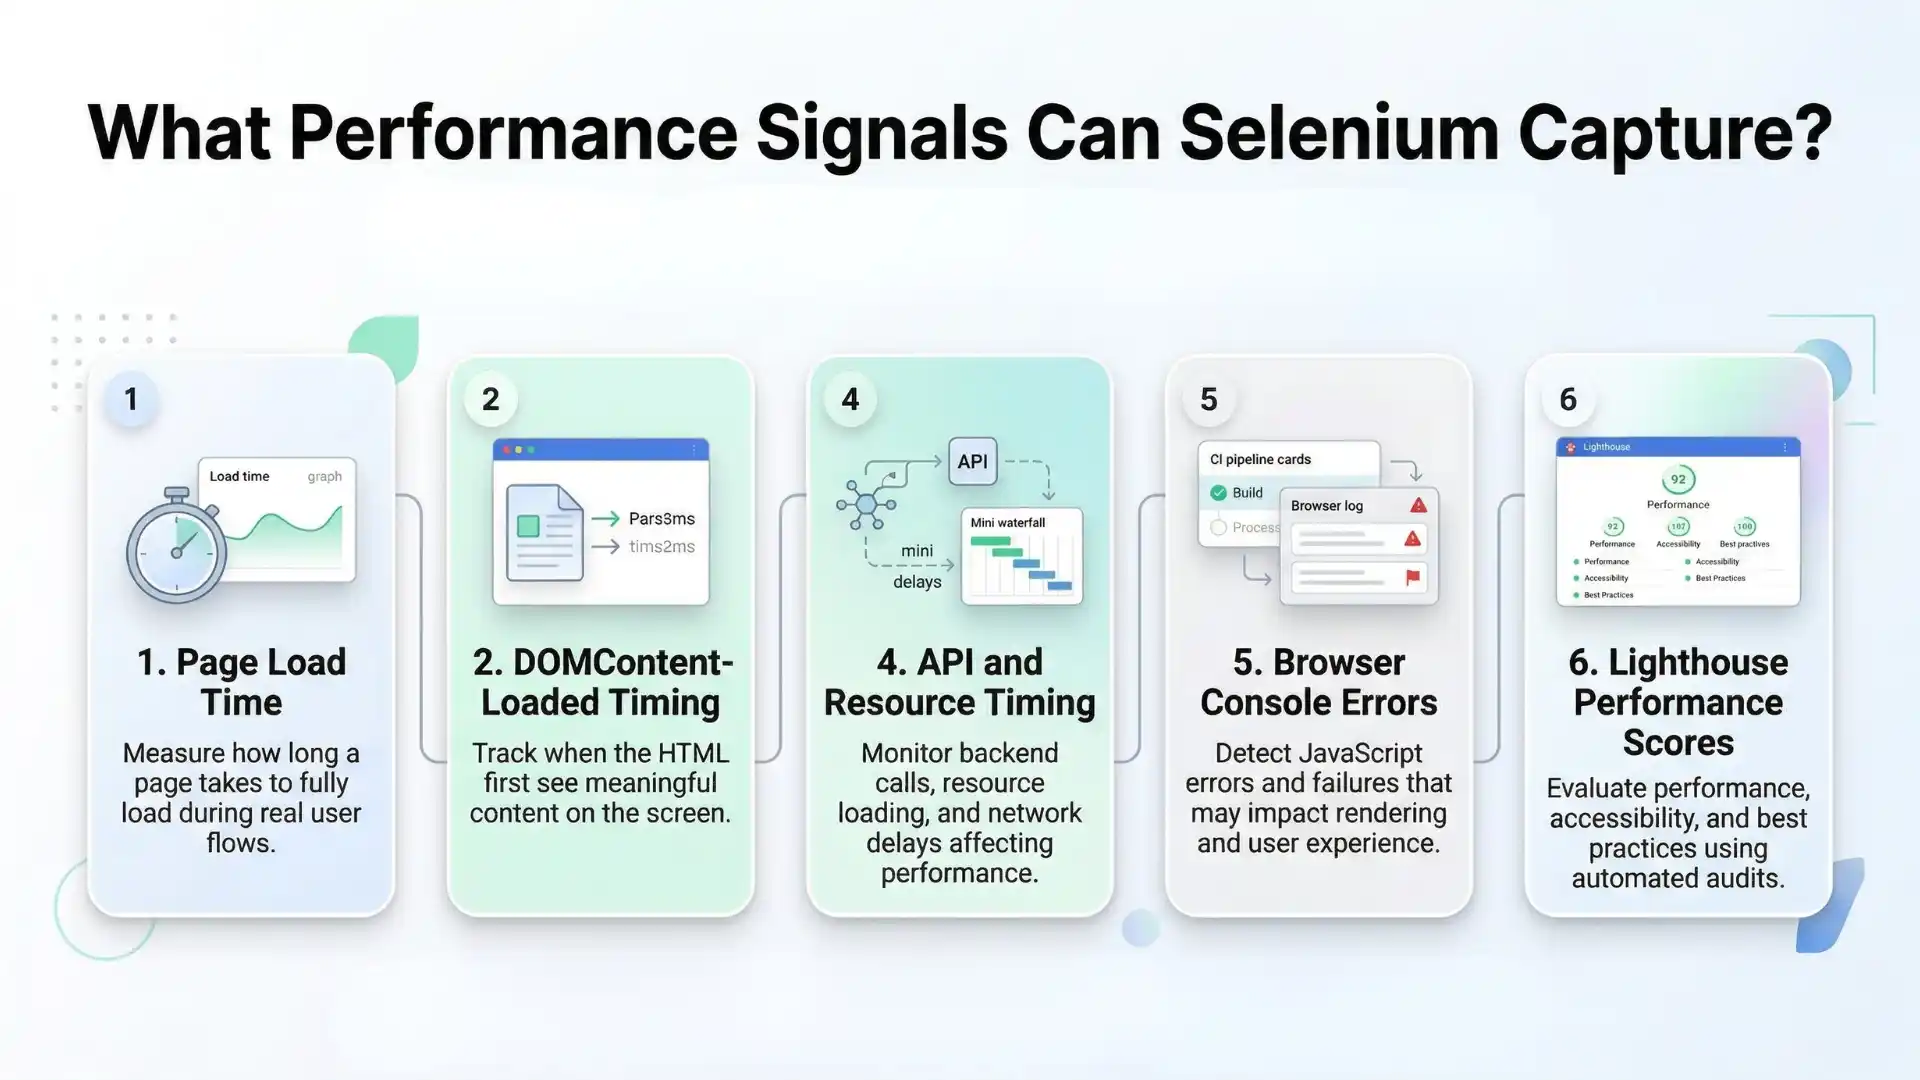
👉 These signals reveal real user experience issues.
Why Selenium Works for Performance Signals
Unlike synthetic performance tools, Selenium operates in real user contexts:
- Real login flows
- Real UI rendering
- Real browser behavior
This makes the data:
- Context-aware
- Journey-based
- More actionable
Example insights:
- “Dashboard takes 3 seconds longer after login”
- “Applying filters slows rendering significantly”
- “New release increased bundle size impact”
You Might Also Like: Highest paying companies in india
What Selenium Is Not Designed For
Selenium is not meant for:
- Load testing with thousands of users
- Stress testing systems
- Backend performance benchmarking
For those, dedicated tools like JMeter or k6 are more suitable.
However, Selenium is excellent as an early warning system for performance regressions.
The Silent Killer: Undetected Performance Regressions
Performance issues are dangerous because:
- They do not break tests
- They do not fail builds
- They quietly degrade user experience
Without performance signals, teams miss:
- Gradual slowdowns
- Third-party impact
- Frontend inefficiencies
- Rendering delays
With performance signals, you detect:
- “Page is 35 percent slower than last build”
- “New script increased load time”
- “Console errors affecting rendering”
- “Lighthouse score dropped on checkout”
These are the issues that directly impact users and revenue.
You Should Also Read: Java selenium interview questions
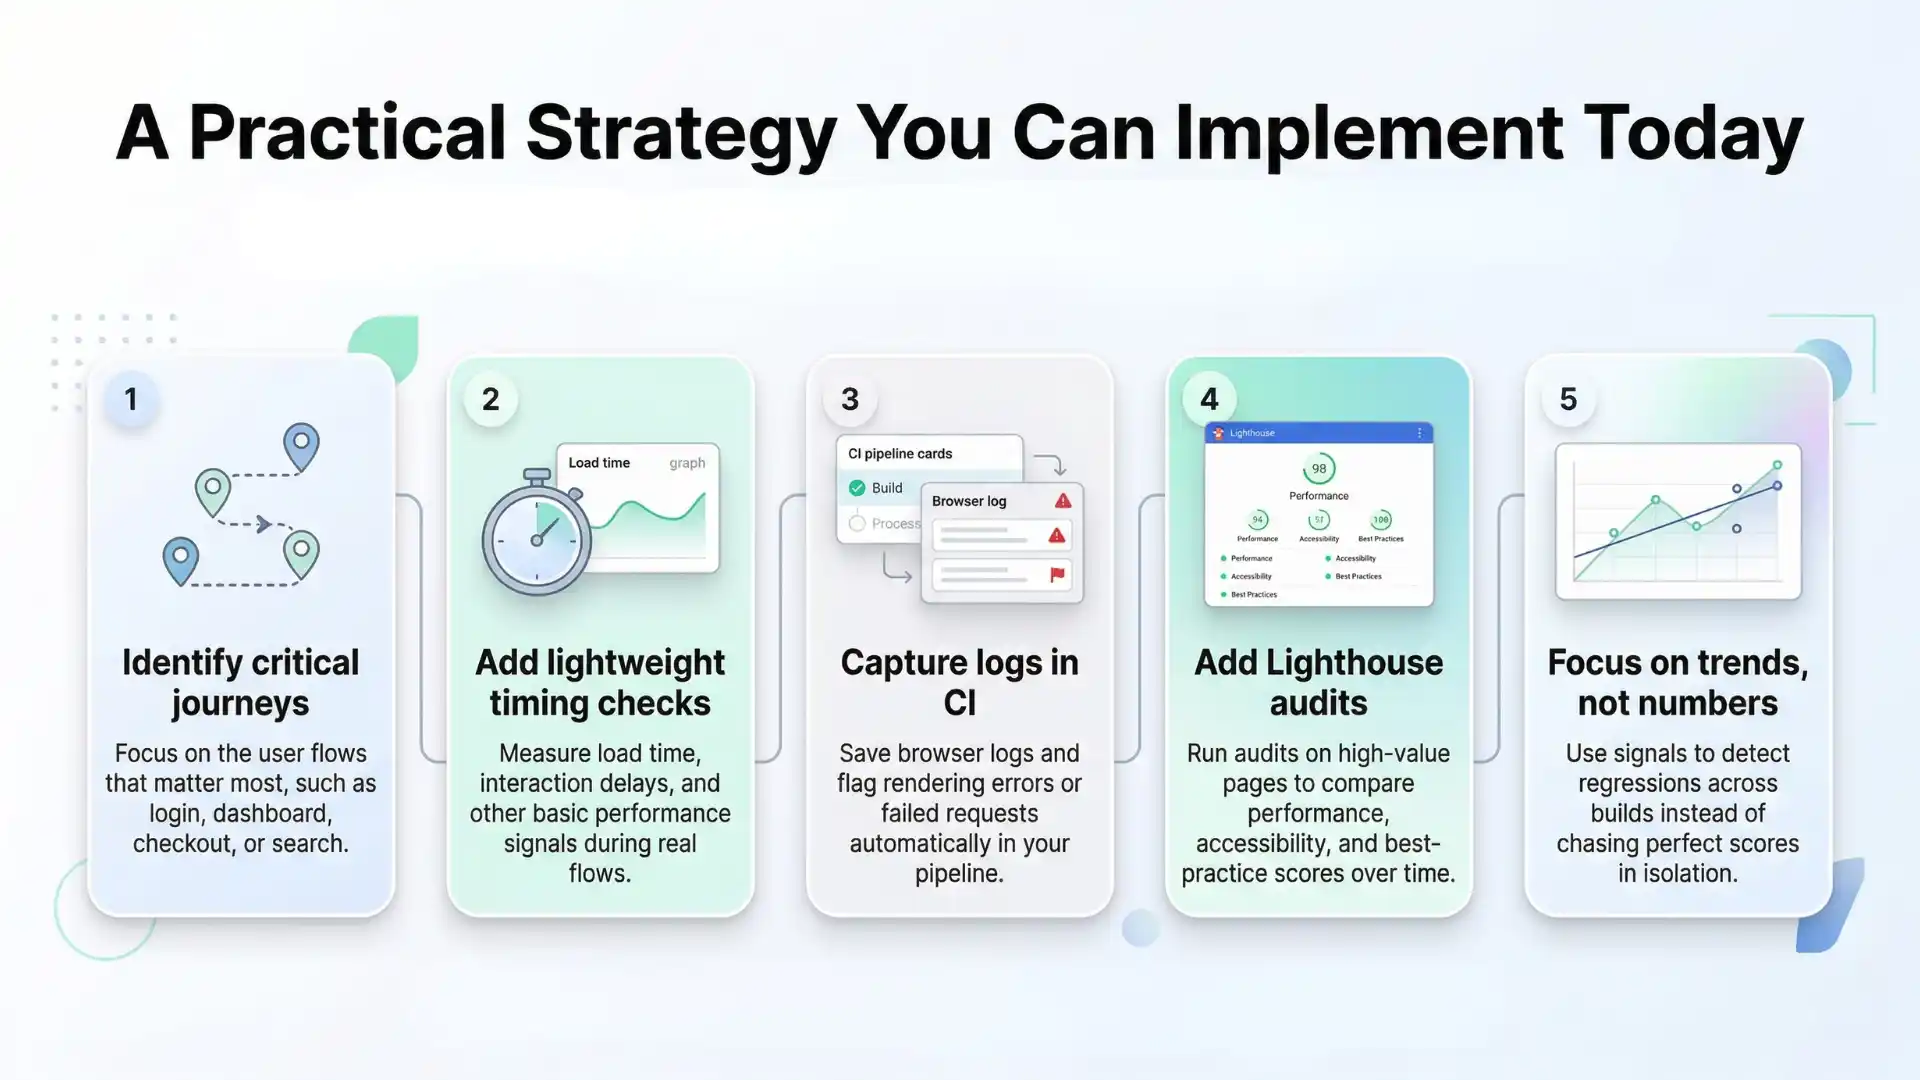
A Practical Strategy You Can Implement Today
You do not need a complex setup.
Start simple:
Step 1: Identify critical journeys
- Login
- Dashboard
- Checkout
- Search
Step 2: Add lightweight timing checks
Track:
- Load time
- Interaction delays
Step 3: Capture logs in CI
- Save browser logs
- Flag errors automatically
Step 4: Add Lighthouse audits
- Only for high-value pages
- Compare scores across builds
Step 5: Focus on trends, not numbers
Performance is about regression detection, not perfection.
Before vs After: The Transformation
| Without Performance Signals | With Selenium Signals |
| Tests pass blindly | Detect slowdowns early |
| No visibility into UX | Full performance insights |
| Late production issues | Early CI detection |
| Reactive QA | Proactive QA |
Thought Leadership Insight
Here is the truth most teams overlook:
“The problem is not too many tests.
The problem is not enough meaningful signals.”
Adding more test cases will not fix performance issues.
Adding better signals will.
The Future of QA: Signal-Driven Testing
As AI accelerates development:
- Features are shipped faster
- UI complexity increases
- Dependencies grow
This creates a new challenge:
Faster development leads to more hidden performance issues.
The QA role is evolving into:
- Signal interpreter
- Performance observer
- Automation strategist
This is the future of quality engineering.
Key Takeaway
- Passing tests do not guarantee user satisfaction
- Performance is a business metric, not just a technical one
- Selenium can act as an early warning system
- The real goal is not more tests, but better signals
Conclusion: Redefining Quality in Automation
Most teams ask:
“Does it work?”
High-performing teams ask:
“Does it still feel fast?”
Selenium will not replace performance testing tools.
But when used strategically, it becomes:
- A continuous signal of user experience
- A guardrail against silent regressions
- A powerful addition to your CI pipeline
Because in modern software:
User experience is quality.
For QA professionals who want to apply these ideas in real projects, structured Selenium training in Chennai can help bridge the gap between basic automation and modern quality engineering. It can help testers learn how to go beyond pass-fail checks, capture meaningful performance signals, and build more reliable automation frameworks that support both product quality and user experience.
FAQs
Why do Selenium tests pass but users still leave?
Selenium tests usually confirm that features work, but they do not automatically detect slow load times, rendering delays, or poor user experience that can still frustrate users.
Can Selenium capture performance signals?
Yes. Selenium can capture performance-related signals such as page load time, DOMContentLoaded timing, browser logs, API and resource timing, and Lighthouse-based audit insights.
What performance signals can Selenium capture?
Selenium can help track page load time, DOM timing, first contentful paint, API and resource timing, browser console errors, and Lighthouse performance scores.
Is Selenium a performance testing tool?
No. Selenium is not designed for load testing or backend benchmarking. It is best used as an early warning system for performance regressions in real user journeys.
How can Selenium help detect performance regressions?
Selenium helps detect performance regressions by measuring timing changes, capturing logs, and comparing Lighthouse scores across builds in critical user flows.
Why are performance signals important in automation testing?
Performance signals are important because a test can pass functionally while the user experience still becomes slower, less responsive, and more frustrating over time.
What is the difference between functional testing and experience testing?
Functional testing checks whether features work. Experience testing checks whether features still feel fast, responsive, and smooth for real users.
What is the future of Selenium in modern QA?
The future of Selenium in modern QA is not just validating functionality, but also acting as a signal-driven layer that helps teams detect silent user experience regressions early.
We Also Provide Training In:
- Advanced Selenium Training
- Playwright Training
- Gen AI Training
- AWS Training
- REST API Training
- Full Stack Training
- Appium Training
- DevOps Training
- JMeter Performance Training
Author’s Bio:


Content Writer at Testleaf, specializing in SEO-driven content for test automation, software development, and cybersecurity. I turn complex technical topics into clear, engaging stories that educate, inspire, and drive digital transformation.
Ezhirkadhir Raja
Content Writer – Testleaf
![]()