
Most QA teams think they’re testing performance.
They’re not.
They’re testing systems, not experience.
And that gap is exactly why users still complain:
- “The app feels slow”
- “Clicks don’t respond immediately”
- “It works… but it’s frustrating”
Here’s the uncomfortable truth:
Passing tests don’t guarantee a fast experience.
The Blind Spot in Modern QA
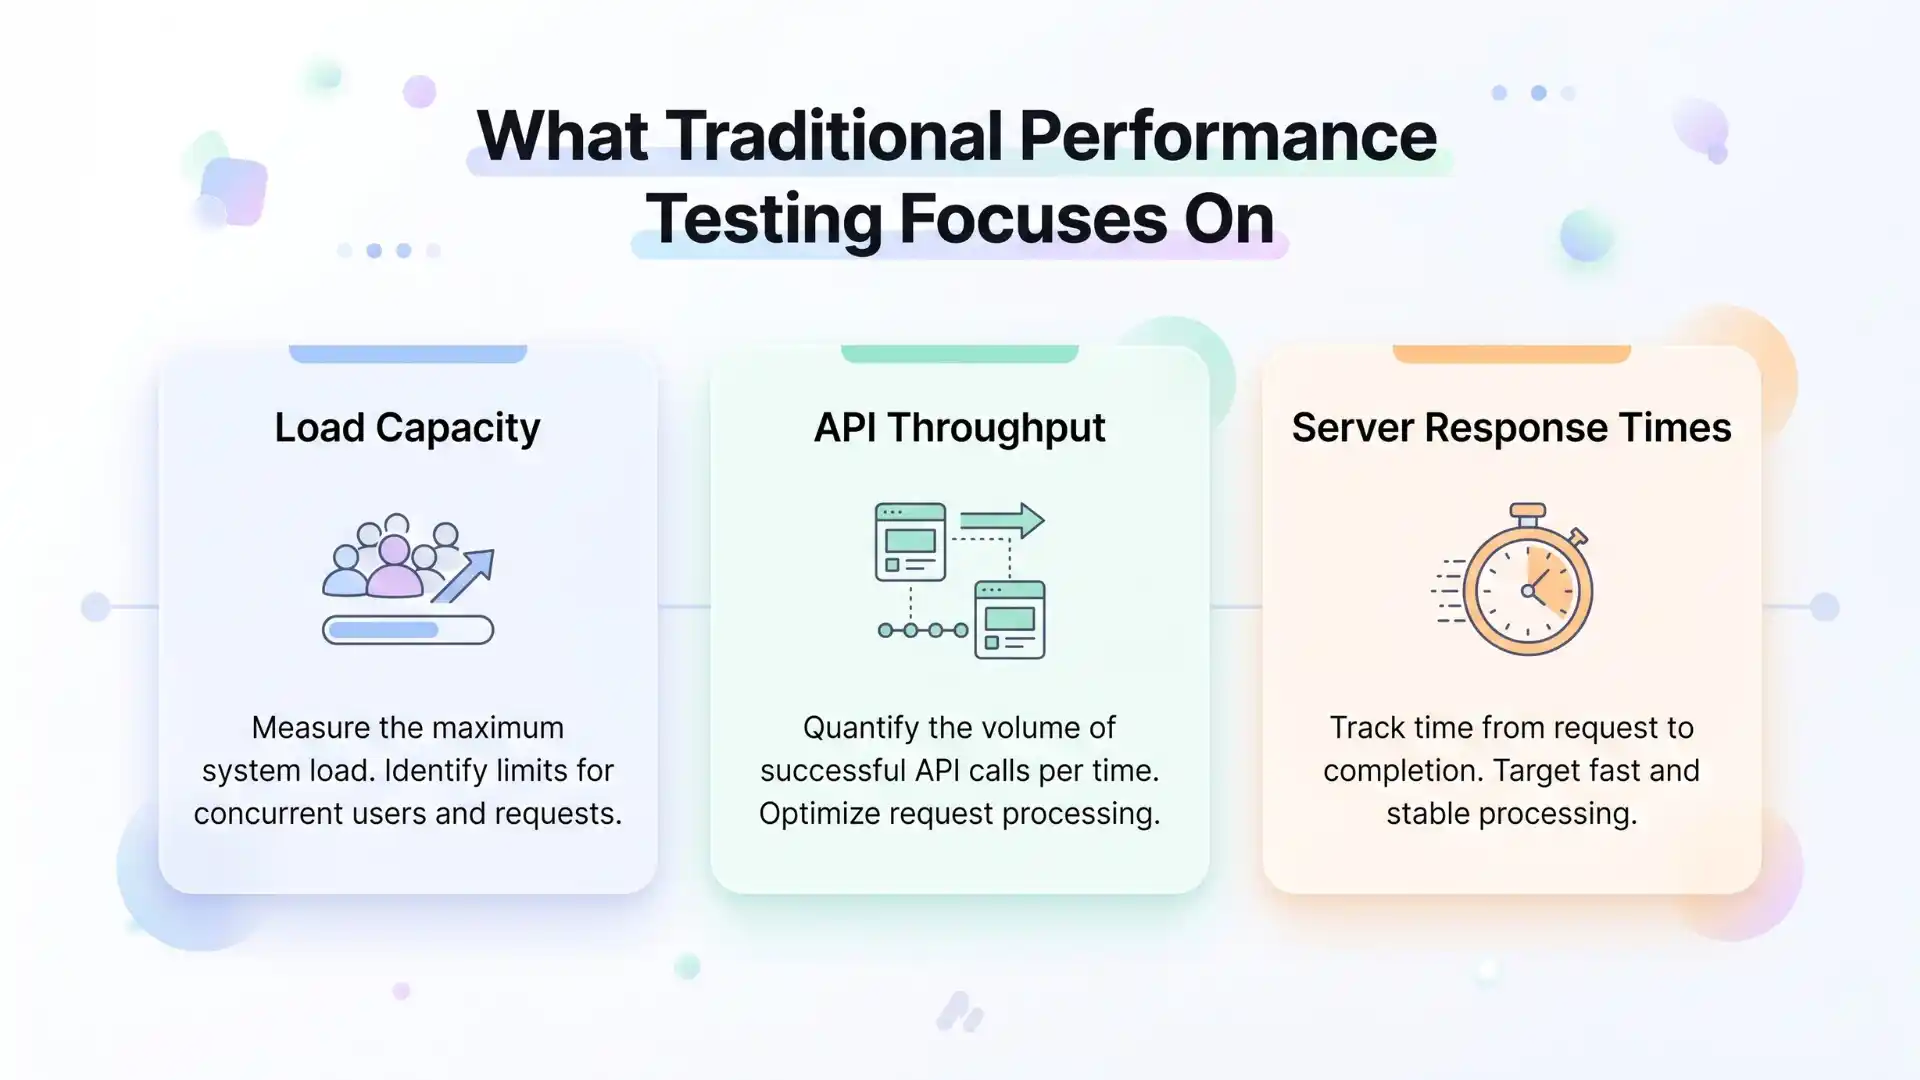
Traditional performance testing focuses on:
- Load capacity
- API throughput
- Server response times
These are important.
But users don’t experience your system as metrics.
They experience it as moments:
- How fast a page responds after a click
- How quickly results appear
- Whether the UI freezes under load
According to Google research:
- A 1-second delay in page load can reduce conversions by up to 20%
- 53% of users abandon mobile sites that take longer than 3 seconds
Yet most QA pipelines never test these moments inside real user flows.
Why do UI tests miss performance bugs?
UI tests miss performance bugs because they validate functionality, not user experience. They check whether actions succeed, but not how fast or smooth interactions feel during real user journeys.
Other Helpful Articles: playwright interview questions
The Shift: From Pass/Fail to Performance Signals
Modern QA is evolving.
It’s no longer about:
“Did the test pass?”
It’s about:
“Did the experience feel fast enough?”
This is where tools like Playwright change the game.
Not because they replace performance tools…
…but because they bring performance visibility into real UI journeys.
What Makes Playwright Different
Playwright does not behave like a traditional performance testing tool.
Instead, it gives you experience-level signals during automation.
The core strengths include:
- Trace timings
- CPU throttling
- Network throttling
- Rich debugging artifacts
The deeper insight most teams miss is this:
Playwright turns every functional test into a performance probe.
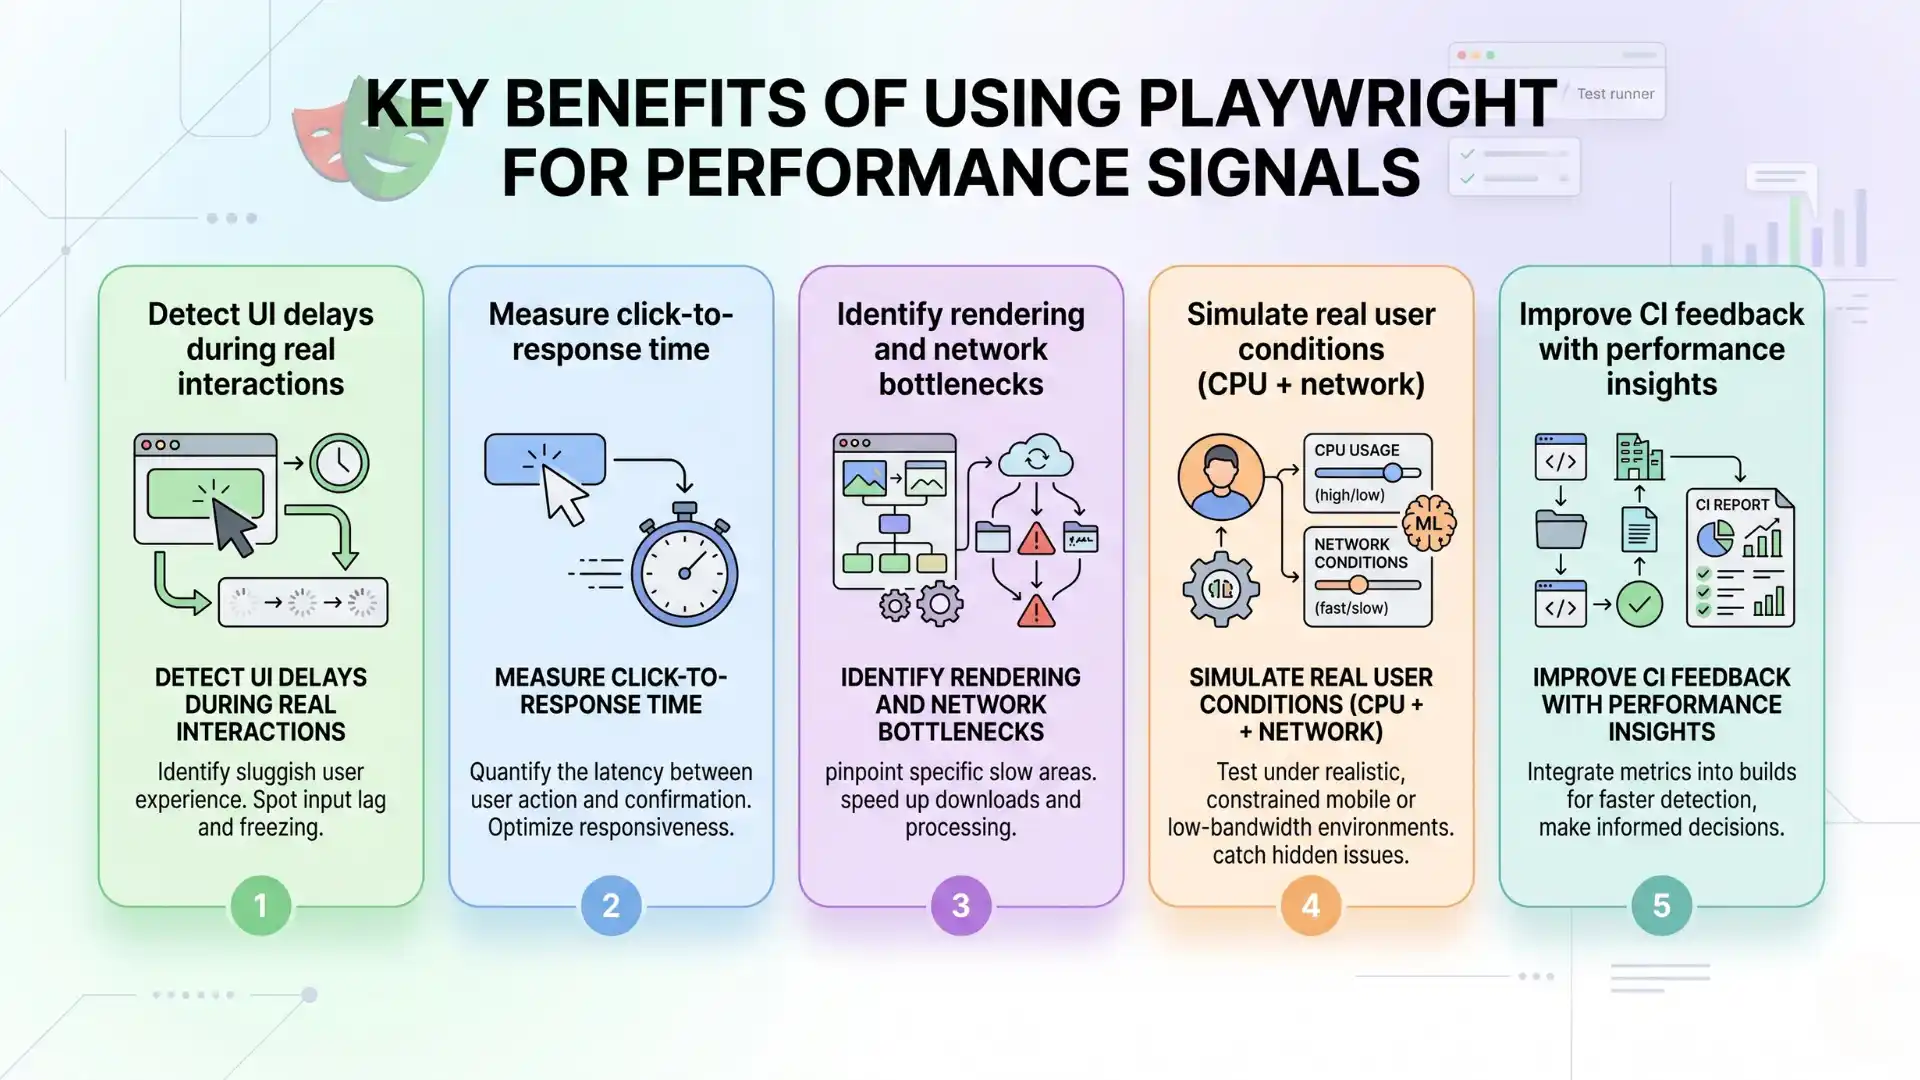
Key benefits of using Playwright for performance signals:
- Detect UI delays during real interactions
- Measure click-to-response time
- Identify rendering and network bottlenecks
- Simulate real user conditions (CPU + network)
- Improve CI feedback with performance insights
Trace Timings: Where Is Time Actually Lost?
Most teams use trace viewer only for debugging failures.
That’s a missed opportunity.
Playwright traces reveal:
- Delays between actions
- Slow UI rendering
- Network wait times
- Hidden blockers
When a test slows down:
- Without trace, you guess
- With trace, you see exactly why
Backend delay, UI rendering lag, or blocking loaders become immediately visible.
This is performance debugging inside real user flows.
You Might Also Like: AI and ML engineer salary in india
Measure What Users Actually Feel
System metrics do not always reflect user experience.
So measure what matters:
- Time from login to dashboard
- Time from click to response
- Time from save to confirmation
These are experience KPIs.
They align more closely with business outcomes than raw technical metrics.
CPU Throttling: A Reality Check for Your UI
Your tests run fast on your machine.
Your users may not have that advantage.
Simulating slower devices helps uncover:
- Heavy rendering
- JavaScript bottlenecks
- Laggy interactions
Performance issues are often device-dependent, not just code-dependent.

Network Throttling: Testing Real Conditions
Fast networks hide real problems.
Actual users face:
- Slow mobile connections
- High latency
- Unstable networks
With network throttling, you can:
- Validate loading states
- Test UI responsiveness
- Expose fragile assumptions
Many applications perform well in ideal conditions but fail under realistic ones.
You Should Also Read: Manual testing interview questions
Traditional Performance Testing vs Playwright Signals
| Aspect | Traditional Tools | Playwright |
| Focus | Load and scale | User experience |
| Speed | Slower feedback loops | Immediate insights |
| Context | Synthetic scenarios | Real user journeys |
| CI integration | Complex | Simple |
| UX visibility | Limited | High |
This is not a replacement.
It is an enhancement.
A Real-World Insight Most Teams Miss
A QA team had:
- 100% passing tests
- No production errors
Yet users complained that the application felt slow.
The issue was a 2–3 second delay after a button click.
Not enough to fail a test.
Enough to frustrate users.
Playwright trace exposed the problem within minutes.
Playwright helps QA teams test performance in real-world scenarios such as:
- Login to dashboard response time
- Search result loading speed
- Checkout interaction delays
- UI responsiveness under slow networks
- Rendering performance on low-end devices
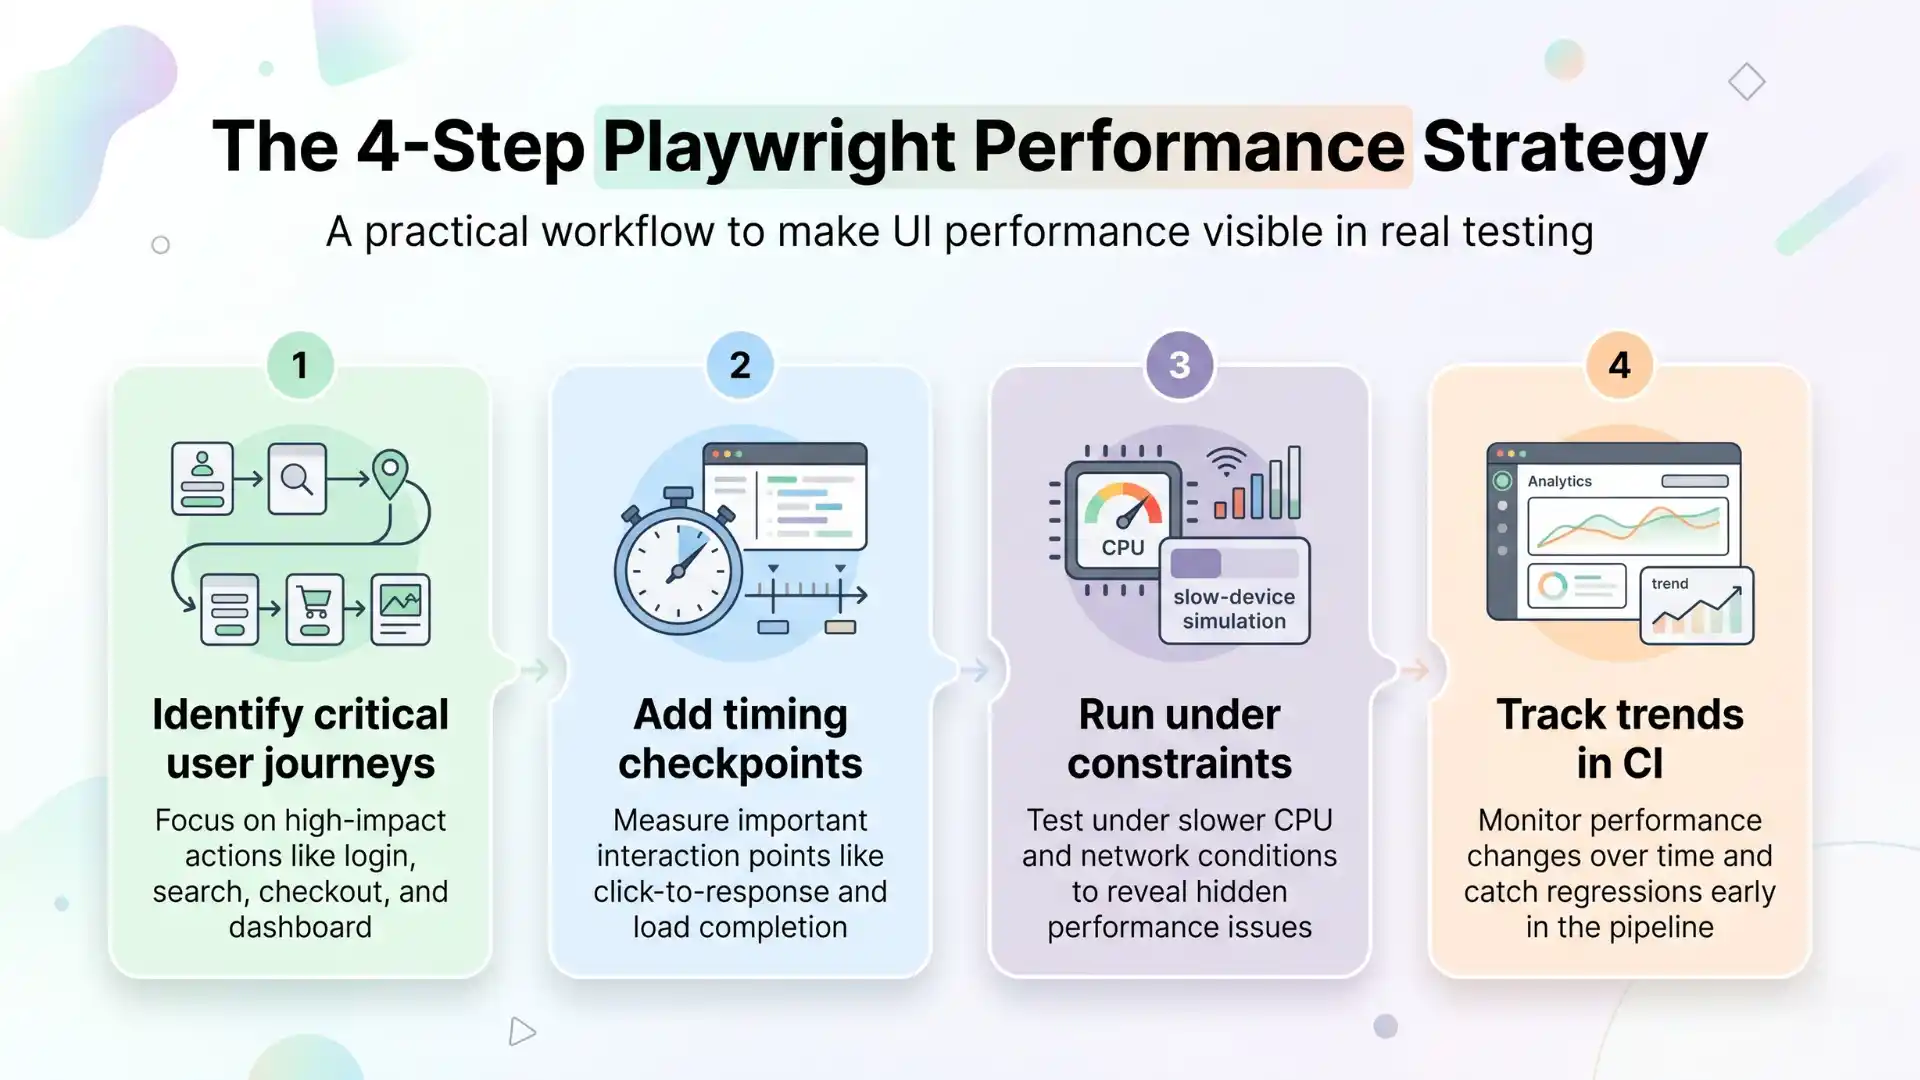
The 4-Step Playwright Performance Strategy
- Identify critical user journeys
Focus on login, search, checkout, and dashboards - Add timing checkpoints
Measure user experience, not just execution - Run under constraints
Apply CPU and network throttling - Track trends in CI
Monitor patterns over time instead of isolated runs
The Myth: “We Already Do Performance Testing”
Let’s be clear:
- Load testing is not UX performance
- API speed is not UI responsiveness
- Lighthouse scores do not reflect real interaction flows
If performance is not tested within user journeys, the experience layer is missing.
The Future of QA: Experience-Driven Testing
The next generation of QA teams will not win by:
- Writing more tests
- Increasing coverage blindly
They will win by:
- Measuring real user experience
- Detecting slowdowns early
- Embedding performance into everyday testing
Playwright enables this shift by making performance visible where it matters most.
Teams in fast-growing tech hubs like Chennai, Bengaluru, and Hyderabad are increasingly adopting Playwright to improve UI performance testing and release confidence.
Final Takeaway
Modern QA teams using Playwright for UI performance testing, alongside traditional performance tools, are shifting toward experience-driven testing that focuses on real user interactions and performance signals.
Performance is no longer separate from quality.
It is a core part of it.
The teams that lead will not be those with the most tests.
They will be those with the most meaningful signals.
Closing Thought
Your system may be fast.
But if your users do not feel it, it does not matter.
FAQs
Why do UI tests miss performance bugs?
UI tests miss performance bugs because they focus on functional pass or fail results instead of measuring user experience. They verify whether an action works, but not how fast or smooth the interaction feels to users.
What is the difference between functional testing and performance testing?
Functional testing checks whether features work correctly, while performance testing measures speed, responsiveness, and system behavior under load. UI performance issues often fall between these two areas.
Can Playwright detect performance issues?
Yes, Playwright can detect performance issues by capturing timing signals, UI delays, network latency, and rendering performance within real user flows. It helps identify slow interactions that traditional tests may miss.
How does Playwright help in UI performance testing?
Playwright helps in UI performance testing by providing trace timings, CPU throttling, network throttling, and detailed debugging insights. It allows teams to measure real user interaction speed inside automated tests.
What is Playwright trace viewer used for?
Playwright trace viewer is used to analyze test execution in detail, including timing, network activity, UI rendering, and delays between actions. It helps identify the exact cause of slow or failed interactions.
What are performance signals in UI testing?
Performance signals in UI testing include metrics like click-to-response time, page load speed, rendering delays, and interaction responsiveness. These signals reflect what users actually experience.
Can Playwright replace performance testing tools?
No, Playwright does not replace performance testing tools. It complements them by adding experience-level insights within UI tests, helping teams detect performance issues during real user journeys.
How do you simulate slow networks in Playwright?
You can simulate slow networks in Playwright using built-in network throttling features, which allow you to replicate real-world conditions like high latency, low bandwidth, and unstable connections.
Why is testing performance inside user flows important?
Testing performance inside user flows is important because users experience performance through interactions, not backend metrics. Measuring real workflows helps identify delays that impact user satisfaction.
What is experience-driven testing in QA?
Experience-driven testing focuses on validating how fast and responsive an application feels to users. It combines functional testing with performance signals to ensure better user experience and product quality.
We Also Provide Training In:
- Advanced Selenium Training
- Playwright Training
- Gen AI Training
- AWS Training
- REST API Training
- Full Stack Training
- Appium Training
- DevOps Training
- JMeter Performance Training
Author’s Bio:

Content Writer at Testleaf, specializing in SEO-driven content for test automation, software development, and cybersecurity. I turn complex technical topics into clear, engaging stories that educate, inspire, and drive digital transformation.
Ezhirkadhir Raja
Content Writer – Testleaf
![]()