As a QA engineer, I’ve spent countless hours compiling test results, screenshots, logs, and defect lists into endless spreadsheets and emails. In the early days of my career, generating a single manual test report often felt like a project of its own. You run the tests, take screenshots, note failures, add them to a document, summarize metrics, and finally, send it for review. By the time the report reached stakeholders, it was often outdated—an artifact of yesterday’s testing, not today’s reality.
Looking back, this manual reporting process was more than just tedious—it was risky, error-prone, and incredibly inefficient. It slowed down our feedback loops, delayed defect resolution, and consumed QA resources that could have been better spent improving test coverage and quality.
The breakthrough came when we shifted from manual reports to automated dashboards, and it completely transformed the way our QA team operated.
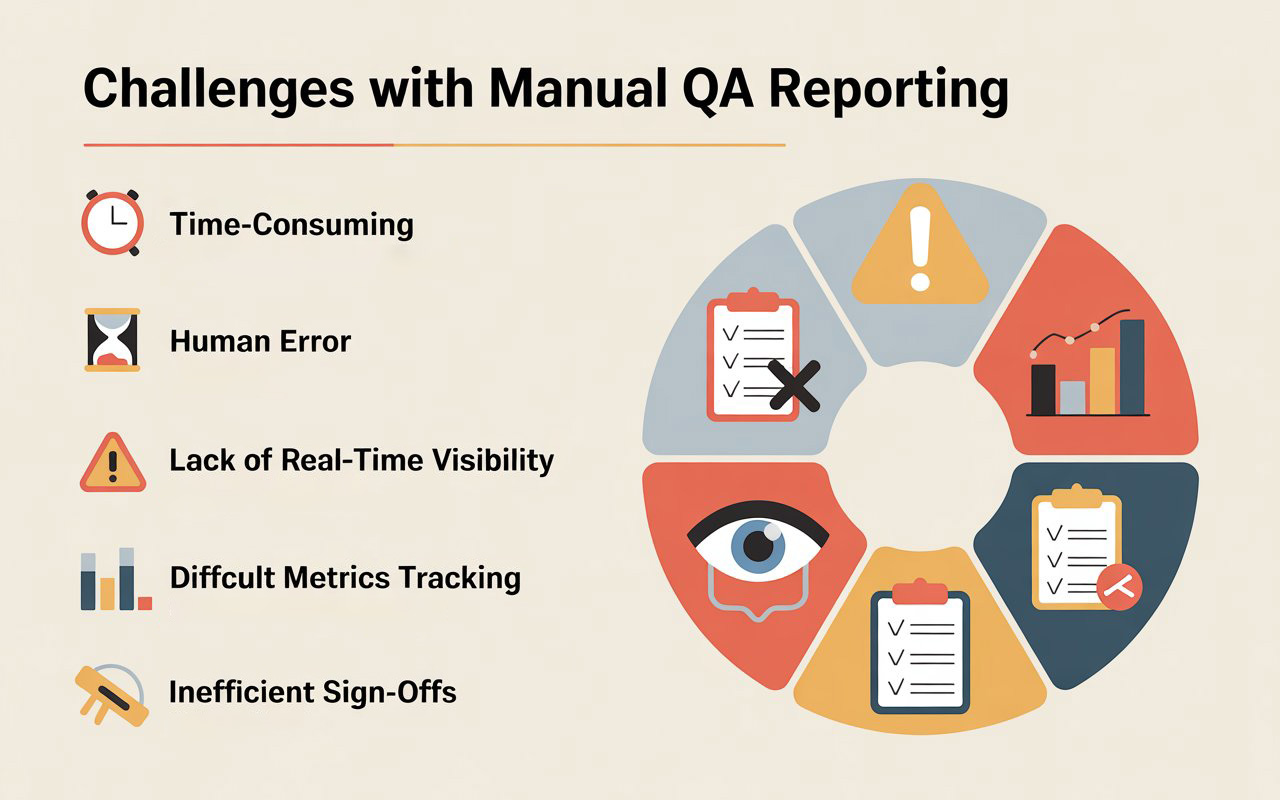
The Pain Points of Manual Reporting
Manual reporting seems straightforward, but in practice, it introduces multiple challenges:
1. Time-Consuming
Generating reports manually took hours, sometimes a full day after a test execution. For large regression suites with hundreds of tests, compiling results, attaching screenshots, and writing summaries was exhausting and repetitive.
2. Human Error
Manually capturing failures or categorizing them often resulted in mistakes or omissions. One missed screenshot or incorrect defect ID could lead to confusion during bug triaging or sign-off meetings.
3. Lack of Real-Time Visibility
By the time reports were shared, test environments had often moved forward. Stakeholders had no real-time view of test progress, making it hard to make informed decisions or identify trends early.
4. Difficult Metrics Tracking
Tracking trends like defect aging, test pass rates, or flaky tests was cumbersome with spreadsheets. Pulling insights required extra effort, and the analysis often lagged behind the actual testing.
5. Inefficient Sign-Offs
Manual reports meant endless meetings, where QA walked developers, managers, and product owners through every detail. It delayed release approvals and created bottlenecks.

Recommended for You: selenium interview questions
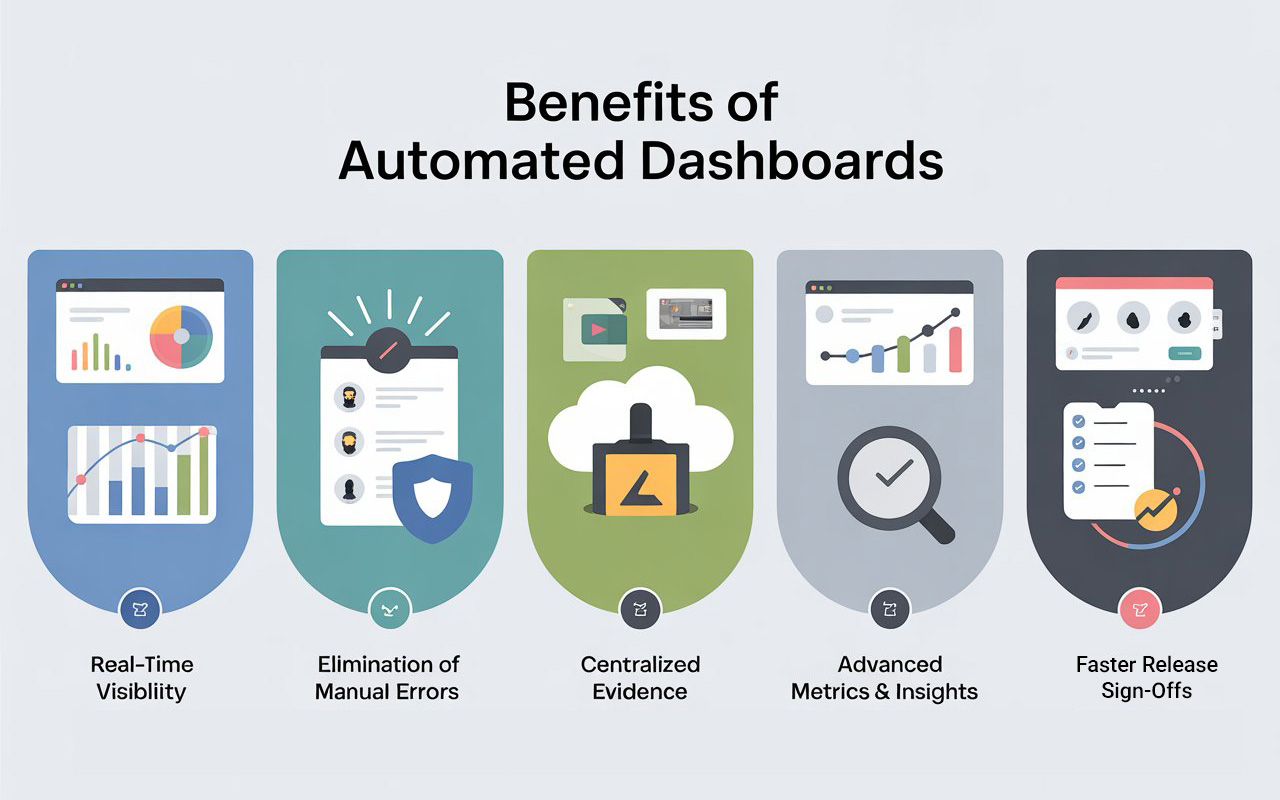
Why Automated Dashboards Are a Game-Changer
Automated dashboards solve the core challenges of manual reporting by providing real-time, actionable, and accurate insights into test executions. Here’s what changed when we made the switch:
1. Real-Time Visibility
Dashboards pull test results directly from our CI/CD pipelines. As soon as a test completes, results appear live. Stakeholders can now see which tests passed, which failed, and trends over time without waiting for a report email.
2. Elimination of Manual Errors
With dashboards, there’s no more copying, pasting, or manually attaching screenshots. Failures are captured automatically, and logs, videos, and screenshots are linked directly to the relevant test case. The accuracy of information skyrocketed, and developers could reproduce issues faster.
3. Centralized Evidence
One of the biggest advantages was centralizing test artifacts. Screenshots, videos, HAR files, and logs are automatically attached to the dashboard, making it easier for QA, developers, and managers to verify failures quickly. No more digging through emails or shared drives.
4. Advanced Metrics and Insights
Automated dashboards allow us to track:
- Test execution trends over time
- Flaky or unstable tests
- Pass/fail ratios per module
- Average defect aging
These metrics helped us identify weak areas in our test suite and prioritize improvements for maximum impact.
5. Faster Release Sign-Offs
Instead of lengthy meetings to review manual reports, stakeholders can now access dashboards anytime, making sign-offs faster and more informed. Decisions are no longer based on static snapshots—they are data-driven and up-to-date.

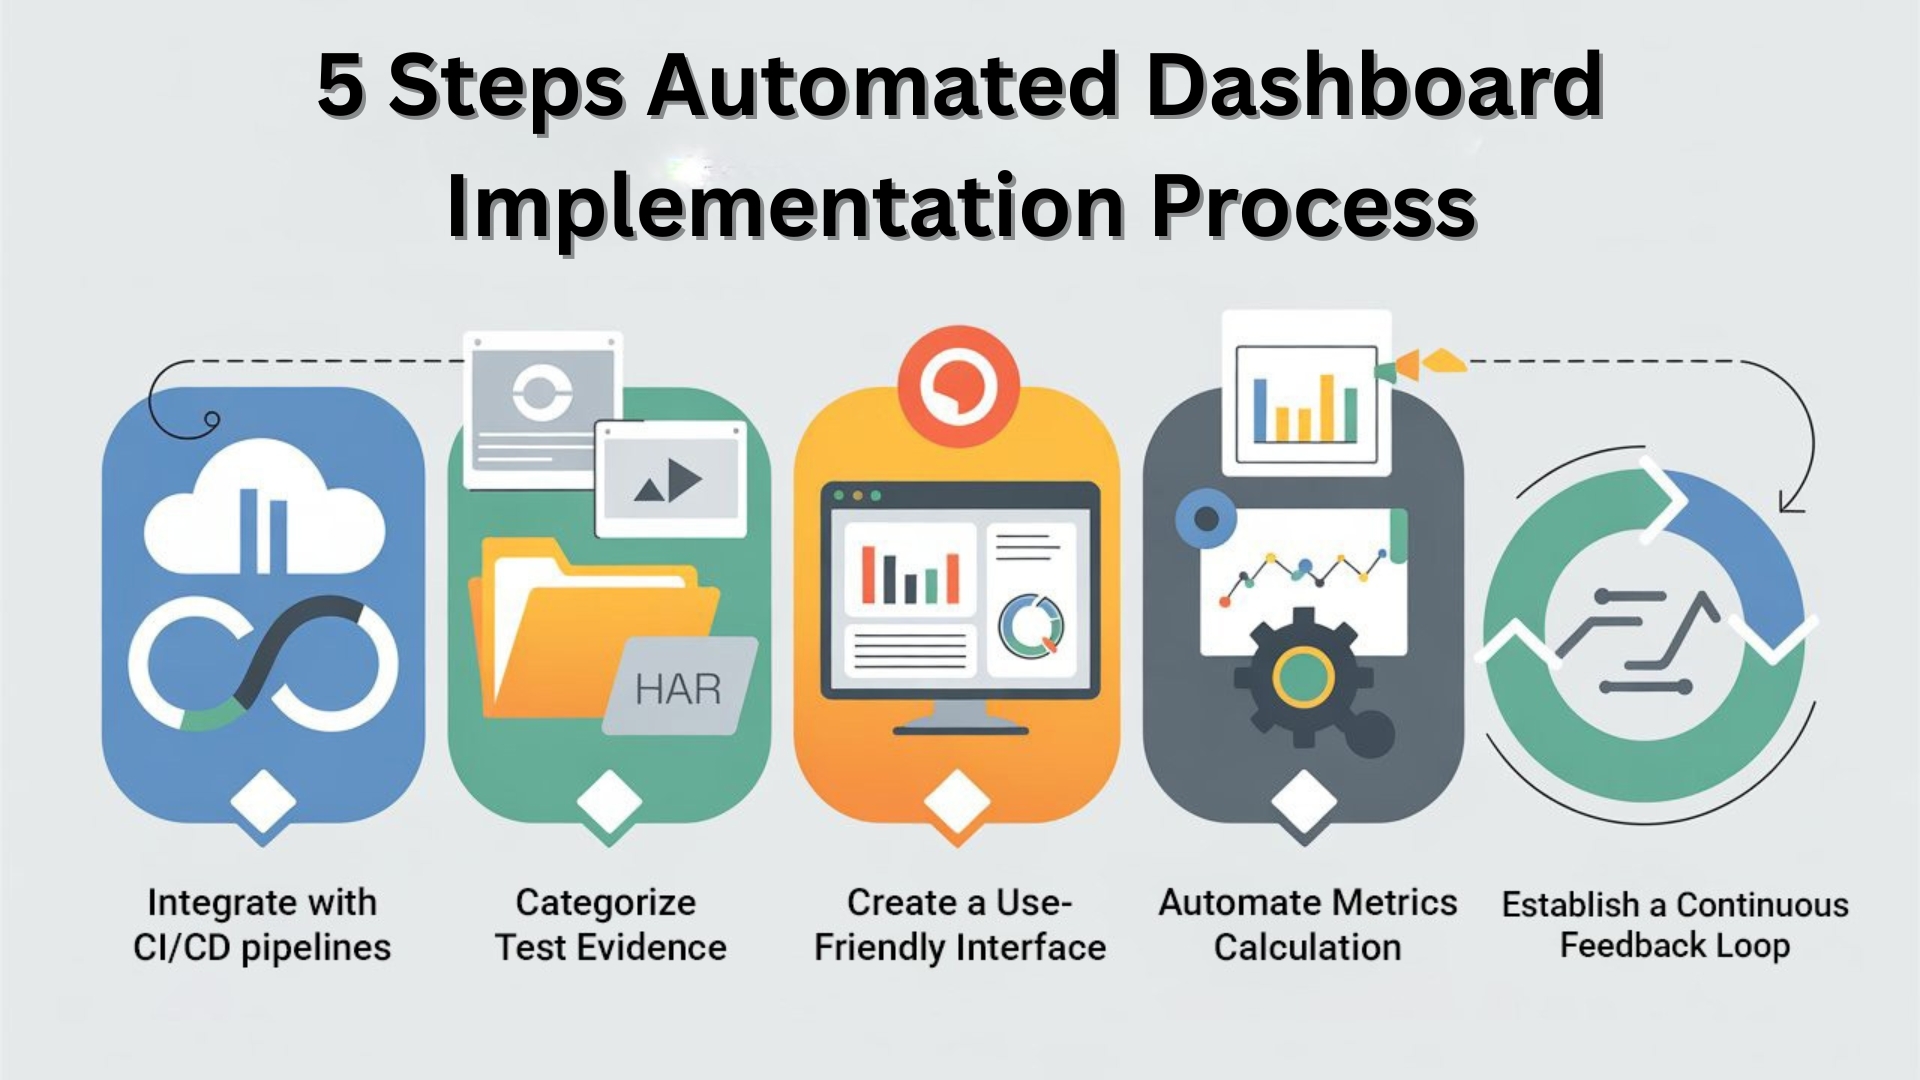
How We Built Our Automated Dashboard
The transformation wasn’t overnight, and it required a systematic approach:
Step 1: Integrate with CI/CD
We started by connecting our test suite to the CI/CD pipeline. Every test execution automatically pushed results, logs, and artifacts to a central location. This integration was critical for real-time updates.
Step 2: Categorize Test Evidence
To make dashboards meaningful, we categorized test evidence:
- Screenshots of failed UI elements
- HAR files for network-level debugging
- Videos for step-by-step execution review
This categorization made it easy to filter and analyze test failures.
Step 3: Create a User-Friendly Interface
We needed a dashboard that could be consumed by everyone, not just QA engineers. Charts, graphs, and filters allowed users to:
- View results by test suite, module, or environment
- Track execution trends and defect patterns
- Access detailed logs and artifacts for failures
The goal was to reduce dependency on QA for interpretation.
Step 4: Automate Metrics Calculation
Metrics like pass/fail percentages, defect aging, flaky test frequency, and execution time were calculated automatically. Previously, compiling these metrics manually took hours, but the dashboard generated them instantly.
Step 5: Continuous Feedback Loop
The dashboard became a central tool for continuous improvement. Flaky tests were identified and fixed, slow-running tests were optimized, and recurring defects were tracked for early resolution.

Other Helpful Articles: Epam interview questions with answers
The Impact on Our QA Process
Switching from manual reports to automated dashboards transformed our QA workflow:
- Time Savings: Hours spent on manual report creation were now invested in improving test coverage and quality.
- Reduced Errors: Test results were accurate and reliable. Developers could reproduce issues without back-and-forth communication.
- Faster Releases: Sign-offs became quicker, and release confidence increased.
- Better Decision-Making: Real-time insights allowed stakeholders to act proactively, not reactively.
- Higher Team Morale: QA engineers were freed from tedious reporting tasks and could focus on meaningful automation and testing challenges.
Lessons Learned
- Automation is not just testing—it’s reporting too
Creating tests is only part of the job. Automating results reporting ensures that the effort invested in testing delivers maximum impact. - Centralized evidence reduces friction
Screenshots, videos, and logs tied to a dashboard improve communication between QA and development teams. - Dashboards empower stakeholders
Real-time visibility builds trust. When teams can see accurate results anytime, decision-making becomes faster and more confident. - Invest early in test data and artifact management
Organizing evidence, logs, and videos for dashboard consumption reduces integration headaches later.
Conclusion
Moving from manual reports to automated dashboards was more than just a technical upgrade—it was a cultural shift in how our QA team operated. We went from spending hours documenting yesterday’s tests to driving real-time insights that improved quality, efficiency, and release confidence.
In my perspective as a tester, this transformation marked a turning point. Automation wasn’t just about running tests—it was about streamlining information, reducing errors, and empowering the entire team. Today, I can confidently say that the QA team’s influence has grown, not because we found more bugs, but because we communicated faster, smarter, and more effectively than ever before.
If you want to see these ideas in action, join our live Selenium Webinar this Saturday, where we build real test automation on enterprise-grade apps:
👉 Register here: From Manual to Automation — in Just 90 Minutes
Already curious about modern frameworks? Don’t miss our Playwright Webinar this Saturday as well – a fast-paced, zero-to-hero session for serious testers:
👉 Reserve your seat: Worried about your testing career in 2026?
Bring your questions, real-world challenges, and career goals – we’ll tackle them live.
FAQs
Q1. What is an automated QA dashboard?
An automated QA dashboard is a live view of test executions, results, and quality metrics that pulls data directly from your CI/CD pipeline or test tools. Instead of manually creating reports, the dashboard updates in real time and shows pass/fail status, defects, trends, and evidence like screenshots or logs.
Q2. Why is manual QA reporting a problem for modern teams?
Manual QA reporting is slow, error-prone, and quickly becomes outdated. Testers spend hours compiling spreadsheets and slides instead of improving coverage or fixing flaky tests. By the time stakeholders see the report, the environment may have changed, making decisions less reliable.
Q3. What are the benefits of moving to automated QA dashboards?
Automated QA dashboards provide real-time visibility, reduce human error, centralize test evidence, and make release sign-off faster. Stakeholders can see current test status at any time, analyze trends, and drill into failures without waiting for a QA-generated report.
Q4. How can I start building an automated QA dashboard?
Start by integrating your test suite with your CI/CD pipeline and sending results to a central store or reporting tool. Then define the key metrics you care about—like pass rate, flaky tests, and defect aging—and visualize them using charts and filters. Over time, refine the dashboard based on what your team actually uses in planning and release meetings.
Q5. What metrics should a QA dashboard include?
A good QA dashboard typically includes test pass/fail trends, module-wise coverage, flaky test frequency, defect counts and aging, and execution time per run. You can extend it with environment-specific results, performance metrics, and links to screenshots, logs, and videos for faster debugging.
We Also Provide Training In:
Author’s Bio:

Content Writer at Testleaf, specializing in SEO-driven content for test automation, software development, and cybersecurity. I turn complex technical topics into clear, engaging stories that educate, inspire, and drive digital transformation.
Ezhirkadhir Raja
Content Writer – Testleaf


